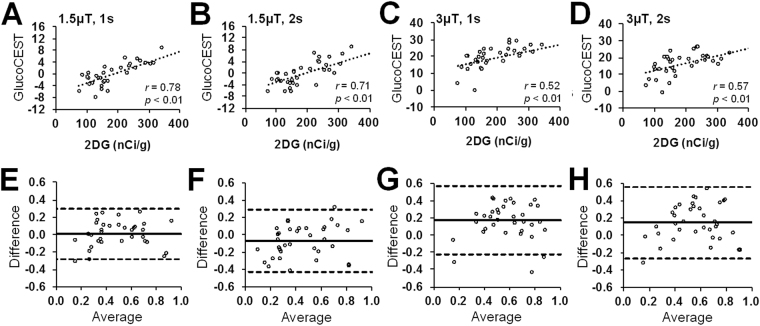
Figure 6.
The correlations (A–D) and Bland-Altman plots (E–H) reveal the relationship and difference between the 2DG autoradiographs and the glucoCEST-weighted images acquired by different saturation pulses: 1.5 μT, 1 s (A,E), 1.5 μT, 2 s (B,F), 3 μT, 1 s (C,G) and 3 μT, 2 s (D,H). A higher correlation (r = 0.78, p < 0.01, n = 6) and agreement (95% CI: −0.28‒0.30) are seen between the autoradiographs and glucoCEST-weighted images by 1.5 μT, 1 s saturation pulses, where the 3 μT, 1 s saturation presents a lower level of correlation (r = 0.52, p < 0.01, n = 6) and agreement (95% CI: −0.23‒0.57) to the autoradiographs.

