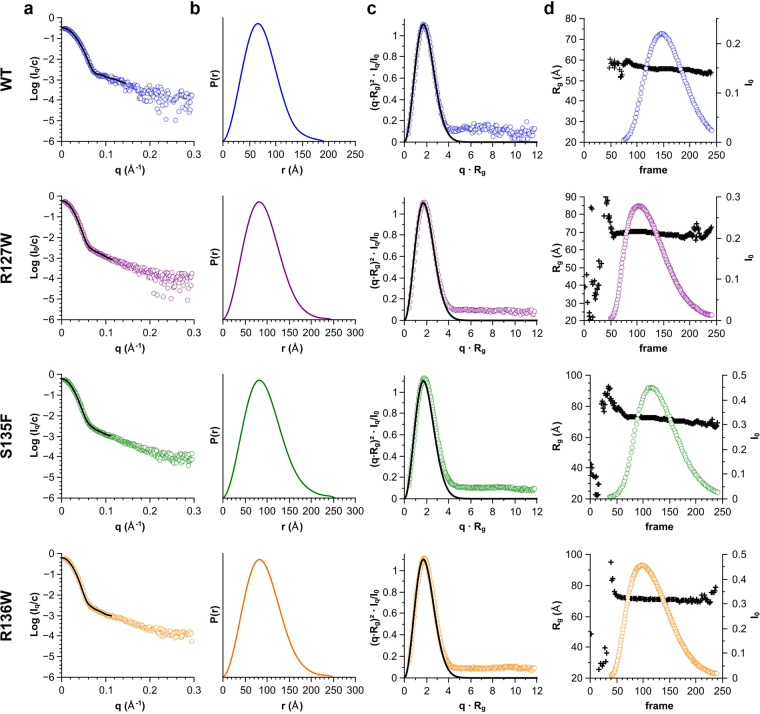
Figure 3.
SEC-coupled SAXS analysis of WT HSBP1 and the three ACD mutants. For each construct four plots are shown: (а) the averaged scattering curve (circles) and overlayed regularized curve (black line) calculated using data at the elution maxima, (b) the corresponding pair-distribution function, (c) dimensionless Kratky plot of the same data, and (d) the radius of gyration (black crosses, left axis) and normalised forward scattering (circles, right axis) at each elution point. For reference the dimensionless Kratky plot also shows the Guinier approximation of a spherical particle at low angles (black line) plotted using the function f(x) = x² * exp(−x²/3).

