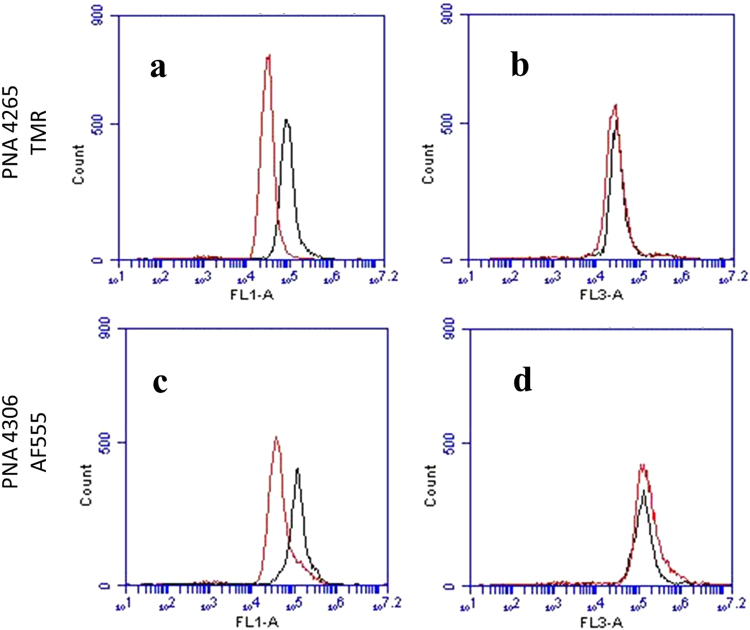
Figure 8.
Flow cytometry analysis of ROS/singlet oxygen production. After co-transfection of the cells with PNA and APF, the cells were irradiated. The level of ROS/singlet oxygen was monitored by the APF fluorescence signal in the green channel (FLA-1). A significant increase in singlet oxygen production is clearly visible by change in the peak position toward the higher fluorescent intensities. The mean FLA-1 increased 3-fold for PNA4265 (a) and 2.3-fold for PNA4306 (c). FLA-3 is the red channel PNA 4265 (c) and PNA 4306 (d) fluorescence. The red graphs represent before and the black graphs after irradiation.

