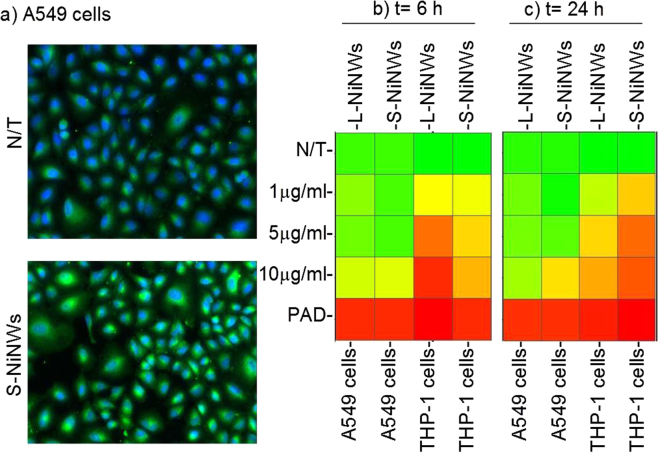
Figure 1.
Citrullination levels in THP-1 and A549 cells exposed to nickel nanomaterials. (a) Representative fluorescent images of untreated controls (N/T), short (S)-NiNWs-treated A549 cells after 24 h exposure. Images show cytoplasmic citrullinated protein (green) and nuclei (blue). (b and c) Heatmaps reflect the citrullination levels indicated by colours ranging from red (≥75%) to yellow (50%) to green (≤25%) compared to negative control (N/T). PAD was used as positive control.

