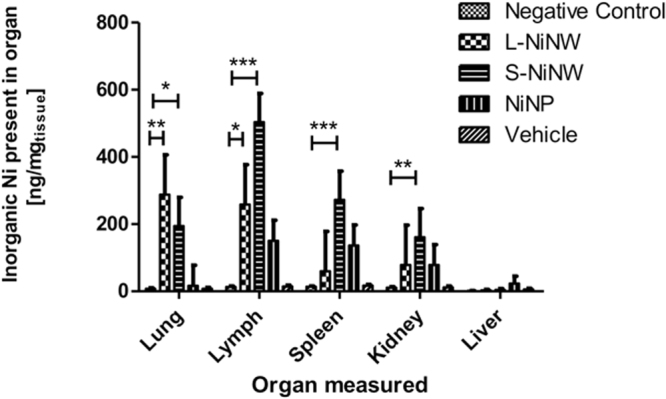
Figure 9.

Quantification of inorganic nickel magnetic material in murine organs after 2-week exposure to nanomaterials (n = 3 animals). Comparison of total mass of nickel nanomaterial measured accumulated in each organ versus organ mass. Inorganic nickel content was measured by SQUID magnetometry as total amount of magnetic signal compared to vehicle. Data are shown as average ± standard error of the mean (nrepeats = 3). The symbols (*), (**) and (***) indicate statistical significant changes as compared to the values measured against negative control samples (p < 0.05, 0.01 and 0.001, respectively) (two-way ANOVA and Bonferroni post-test).
