
Figure 6.
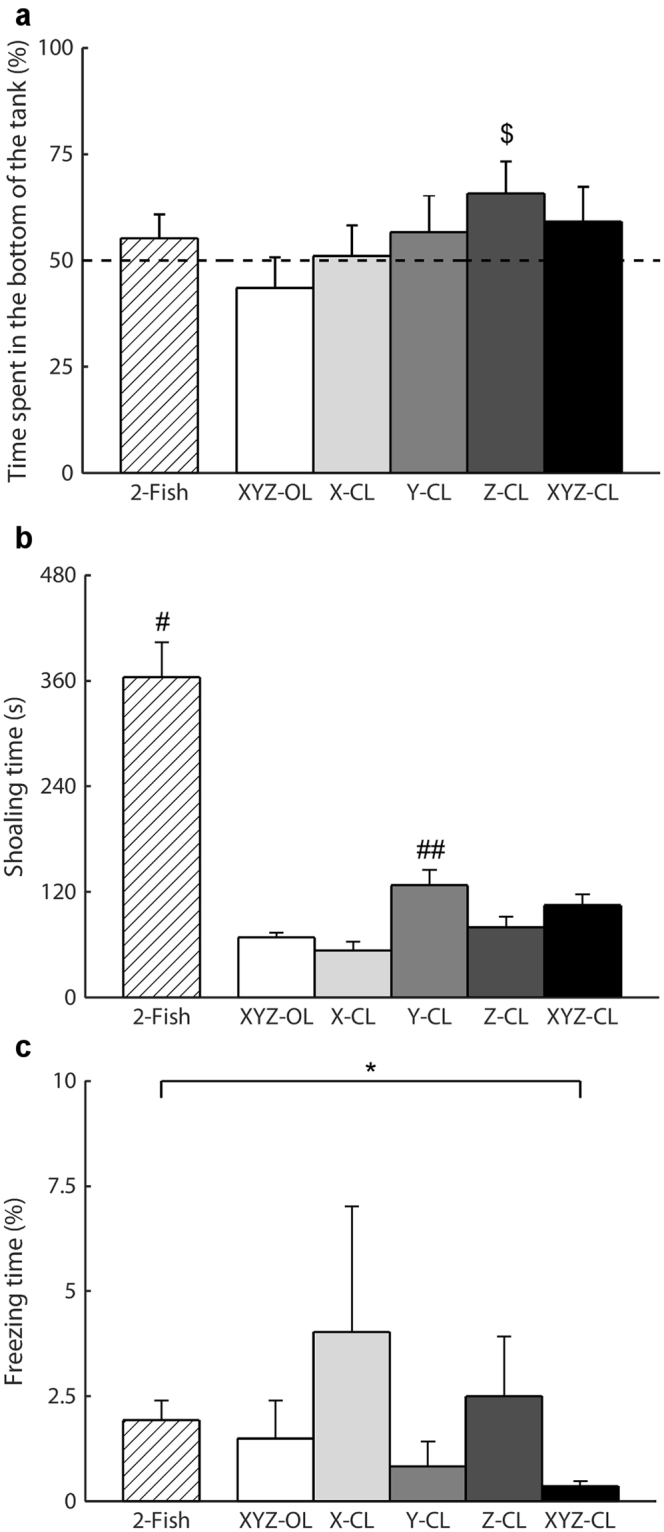
Analysis of spatial preference and activity. The bar plots show the time spent in the bottom of the tank (a), shoaling time (b), and time spent freezing by the focal fish (c) for the six experimental conditions (2-Fish: two live zebrafish; XYZ-OL: open-loop condition; X-CL: closed-loop with respect to the X-axis; Y-CL: closed-loop with respect to the Y-axis, Z-CL: closed-loop with respect to the Z-axis; and XYZ-CL: closed loop with respect to all axes). Dollar symbol indicates p < 0.05 in one-sample t-test comparison with chance, indicated as a dashed line. Octhorpe symbol indicates p < 0.01 in pairwise comparison with all other replica conditions. Double octhorpe symbol indicates p < 0.05 in post-hoc comparison with XYZ-OL and X-CL. Asterisk symbol indicates p < 0.01 in pairwise comparison. Data are represented as average + standard error.