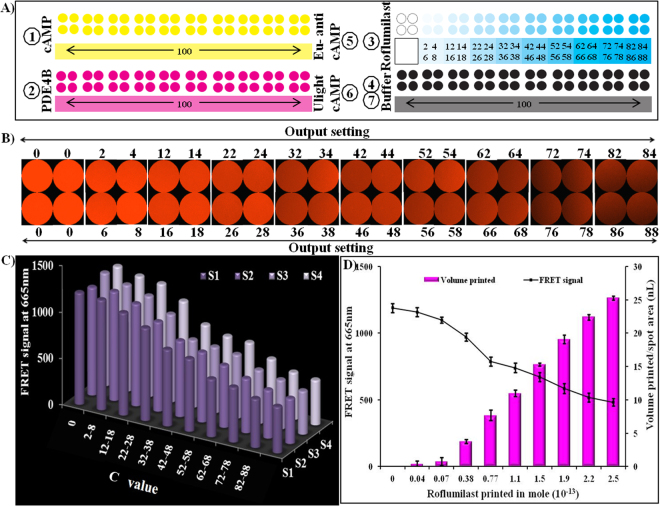
Figure 5.
Inkjet-printing based determination of PDE4B inhibition by roflumilast. (A) Represents printing order; (B) fluorescence signal generated on parchment paper as a function of C value; (C) graph represents the average fluorescence intensity of the individual images (4A) as a function of C value; and (D) the X-axis represents the number of mole of roliparm printed per spot, the primary Y-axis represents the FRET signals produced in the presence of cAMP, PDE4B and roflumilast, and the secondary Y-axis represents the ejection volume of roflumilast. Error bars represent the standard deviation of three independent measurements.

