
Figure 2.
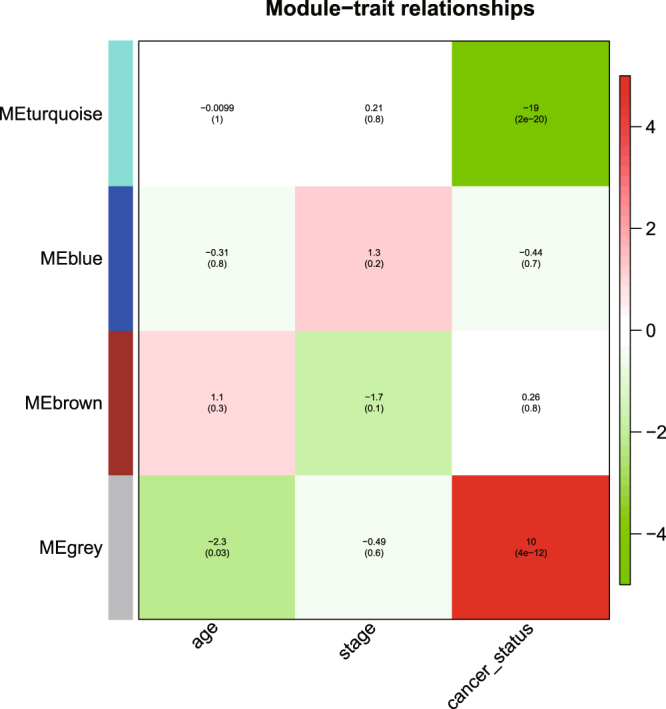
Module-trait association. Each row corresponds to a module; each column corresponds to a trait. Each cell contains the test statistic value and its corresponding p value from the linear mixed-effects model.
Official websites use .gov
A
.gov website belongs to an official
government organization in the United States.
Secure .gov websites use HTTPS
A lock (
) or https:// means you've safely
connected to the .gov website. Share sensitive
information only on official, secure websites.
Module-trait association. Each row corresponds to a module; each column corresponds to a trait. Each cell contains the test statistic value and its corresponding p value from the linear mixed-effects model.