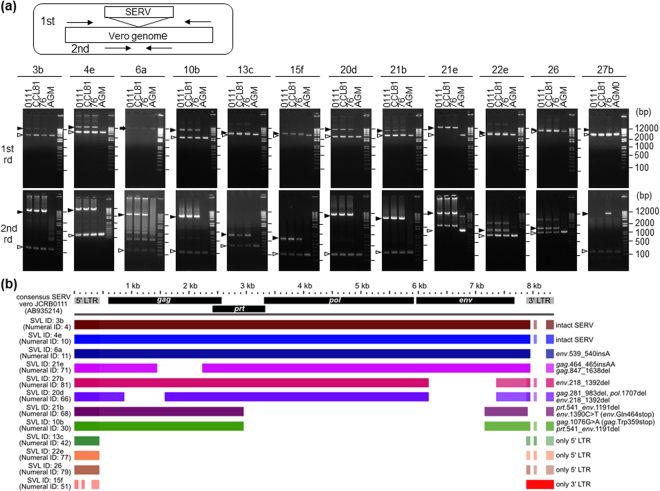
Figure 3.
Structural comparison of SERV from different Vero sublines and different SVL. (a) Validation of Vero cell-specific SVL by genomic PCR. Nested PCR experiments were performed using genomic DNA from the three Vero cell sublines and AGM PBMC as described in the Methods. A schematic picture of nested PCR with the primer-binding sites is shown at the top. SVL IDs are specified under the panel. The black arrowheads indicate SERV-integrated PCR fragments, and the white arrowheads SERV-unintegrated PCR fragments. The arrow indicates an unknown band. Note that the sizes of smaller bands are consistent with the sizes expected for SERV-unintegrated genome sequences. 1st rd: 1st round PCR, 2nd rd: 2nd round PCR. All gel images shown include full-length without grouping. (b) A comparative analysis among twelve Vero cell-specific SVL regions. The colored bars show that the homologous region had at least 80% identity between the consensus SERV sequence found in the Vero 0111 genome (GenBank: AB935214) and each SERV region. Genetic features including mutations for respective SVLs are shown on the right side. Identity with 5′-LTR and 3′-LTR sequences of the AB935214 reference in the BLASTN homology search are: 94.3 and 73.4% for SVL13c, 72.0 and 99.0% for SVL15f, 95.4 and 74.0% for SVL22e, and 94.7 and 74.2% for SVL26, respectively. Due to the high identities with both LTRs of the reference, both 5′- and 3′-LTR regions of these SVL integrations are depicted in the panel, although the SVLs with no intervening sequence (13c, 15f, 22e, and 26) are the solo LTRs as highlighted on the right side of the panel.

