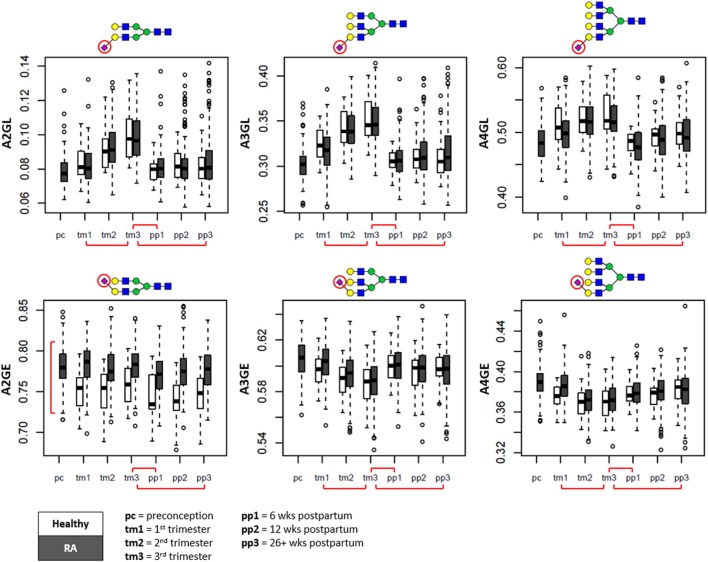
Figure 4.
Sialylation changes throughout pregnancy and the postpartum period shown in boxplots. Whereas α2,3-linked sialylation (L) displays the most prominent change throughout pregnancy (top row), α2,6-linked sialylation shows the most distinction between patients and controls (bottom row). Separation is made between pregnancies of patients with rheumatoid arthritis (RA) (in gray) and healthy controls (in white). A2GL, α2,3-linked sialylation per galactose of diantennary species; A3GL, α2,3-linked sialylation per galactose of triantennary species; A4GL, α2,3-linked sialylation per galactose of tetraantennary species; A2GE, α2,6-linked sialylation per galactose of diantennary species; A3GE, α2,6-linked sialylation per galactose of triantennary species; A4GE, α2,6-linked sialylation per galactose of tetraantennary species. Red brackets indicate statistically significant findings between time points (horizontal), or between healthy individuals and RA patients (vertical).

