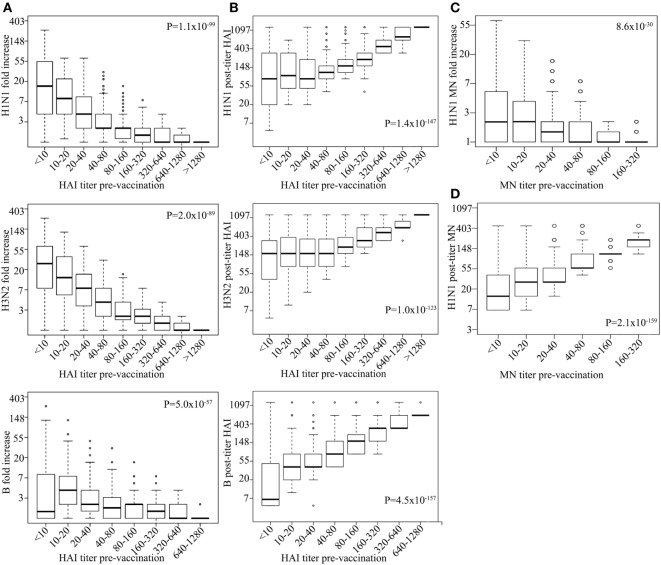
Figure 1.
High-pre-vaccination titer strongly decreases antibody response upon influenza virus vaccination. Boxplot showing log hemagglutination inhibition (HAI) fold increase for H1N1, H3N2, and B (y-axes) vs. corresponding pre-vaccination titer (on x-axes) (A). Log H1N1, H3N2, and B HAI post-vaccination titer (y-axes) vs. corresponding pre-vaccination titer (x-axes) (B). Log H1N1 microneutralization (MN) fold increase (y-axes) vs. pre-vaccination MN titer (x-axes) (C) and log H1N1 MN post-vaccination titer vs. H1N1 pre-vaccination titer (D). Line within the boxplots indicate median value and the top and the bottom correspond to the 25th (Q1) and 75th (Q3) quantiles. The whiskers of the box plots are located at Q1 − 1.5 interquartile range (IQR) and Q3 + 1.5 IQR. P-values for association between fold change and pre-vaccination titer (A,C) and post-vaccination titers and pre-vaccination titer (B,D) are shown. Age, measurement date, previous influenza vaccination status, and gender were included as covariates.

