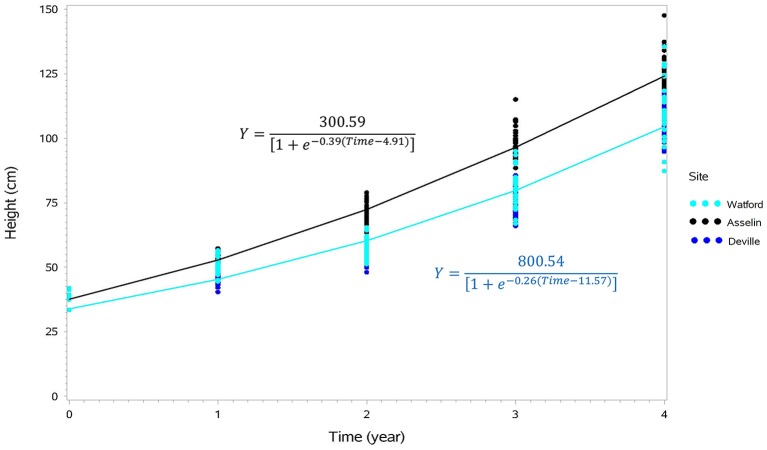
Figure 3.
Cumulative height growth curves representing the growth of seedlings from eight seed orchards on the Watford (south), Asselin (intermediate), and Deville (north) forest sites during four growing seasons after outplanting, and their associated equations (Asselin site in black and the Watford and Deville sites in blue, not significantly different). Each point for time 0 corresponds to the average for each seed orchard (n = 15) just before planting and each other point represents the average of an experimental unit (orchard/block/site; n = 63).

