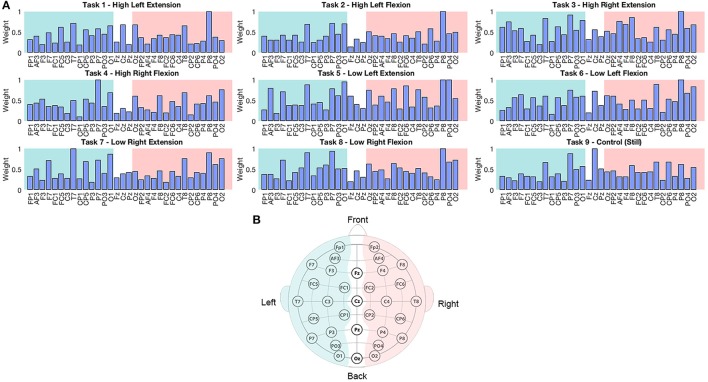
Figure 4.
(A) Normalized weights obtained for each task in EEG classification. Bars located on the green area correspond to the sensors located in the left hemisphere, bars in the white area correspond to the midline, and electrodes in the pink area correspond to the right hemisphere. (B) Location of 32 EEG electrodes over the scalp using the 10–20 extended system.

