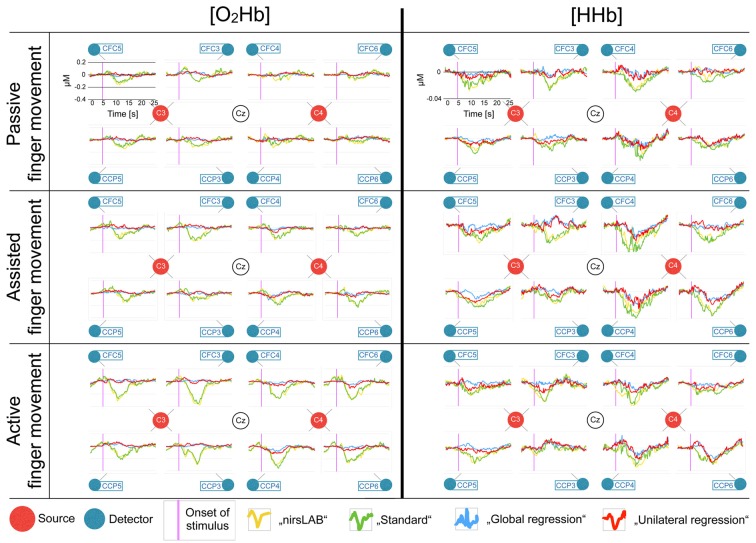
Figure 4.
Block averages of each channel, separately for [O2Hb] and [HHb]. All eight recorded channels of the motor cortex are displayed in a top-view topographical organization around the left (C3) and the right motor cortex (C4). The labels in the red dots/next to the blue dots indicate 10/20 EEG positions. Shown are block averages of the data analyzed with nirsLAB-based signal processing (yellow curves), with the self-implemented signal processing: “standard” (green curves), with the self-implemented signal processing: “multi-channel regression type A: global regression” (blue curves), and with the self-implemented signal processing: “multi-channel regression type B: unilateral regression” (red curves). The x-axes display the time from 0 s to 25 s (purple line indicates stimulus initiation) and the y-axes display the relative hemoglobin concentration (0 corresponds to the median baseline), whereby the scales were kept constant for all curves in [O2Hb] and [HHb], respectively, to facilitate comparison (according to the axes in each top left chart).

