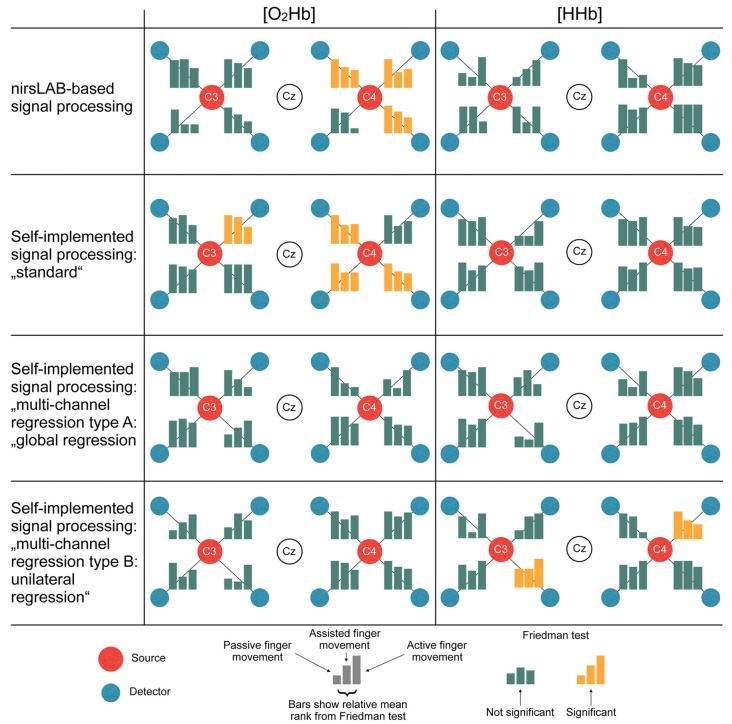
Figure 6.
Statistical consequences of applying different signal processing methods. The bars represent the relative mean ranks from the non-parametric Friedman test (corresponds to the parametric repeated measures analysis of variance (ANOVA)) per channel in a top-view topographical organization around the left (C3) and the right motor cortex (C4). The labels in the red and white dots indicate 10/20 EEG positions. Yellow bars indicate that the Friedman test was significant, thus showing a statistical difference between the signal processing methods.

