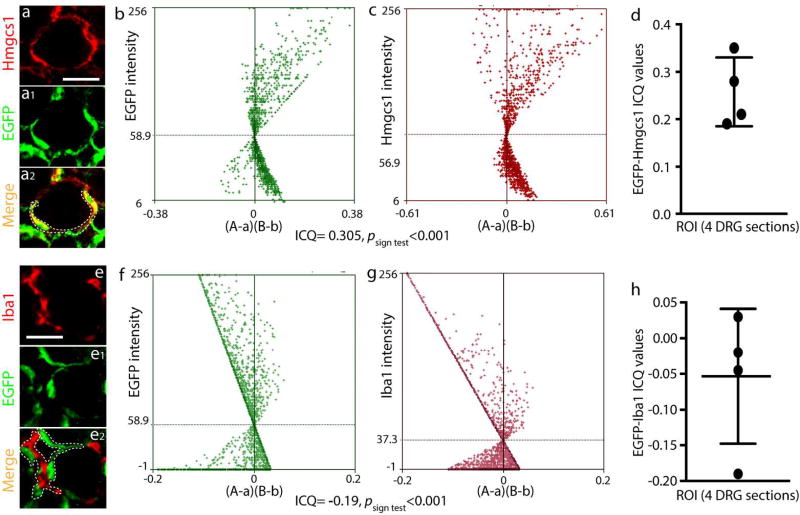
Figure 3. Intensity correlation analysis of EGFP with Hmgcs1 or Iba1.
Pseudocolor images of a representative DRG section 5 weeks after AAV6-GFAP-EGFP injection labeled with Hmgcs1 (a) and EGFP (a1), with the merged image (a2) showing co-labeling (yellow). Scatter plots for the region demarcated by the white dashed line in a2 show strong right skewing for EGFP (b) and Hmgcs1(c). In these panels, “A” is the intensity of EGFP while “a” is the average of these values, and “B” is the intensity of Hmgcs1 while “b” is the average of these values. For this region, the ICQ value is 0.28 (P<0.001). ICQ values (d) for EGFP/Hmgcs1 staining of matched ROIs (the green and red colors varied in close synchrony) (n=4 DRGs). EGFP colabeling with Iba1did not found colocalization (e to e2). Scatter plots for the region outlined by the white dashed line in e2 show strong left skewing for EGFP (f) and Iba1 (g). In these panels, “A” is the intensity of EGFP while “a” is the average of these values, and “B” is the intensity of Iba1 while “b” is the average of these values. The ICQ value for the region = −0.19 (P<0.001). ICQ values (h) for EGFP/Iba1 staining of matched ROIs (n=4 DRGs). Scale bar: 100µm for all panels.

