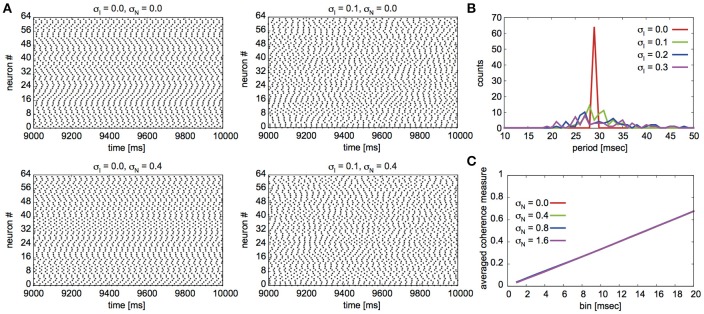
Figure 3.
Simulated neuronal spikes utilized in the phase dynamics estimation. Raster displays of a globus pallidus neuronal network and characteristics of the network activity for case B. Spiking activity of the neurons under the various conditions (A), distributions of firing periods for the different standard deviations σI (B), and changes in the average coherence measure as a function of bin size for different standard deviations of noise σN (C). The parameter values are the same as those described in Figure 2.

