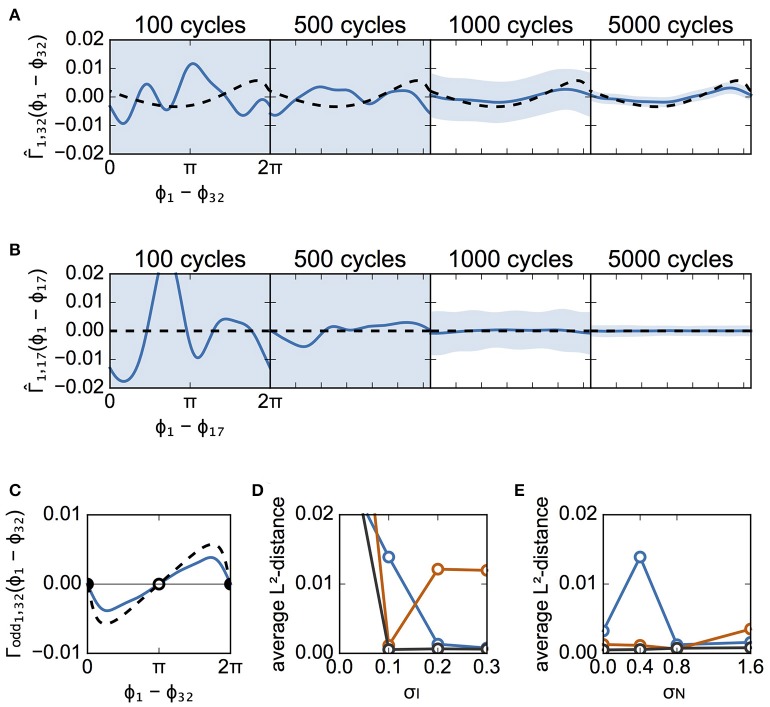
Figure 5.
Estimated interaction function for case A. (A) Estimated interaction functions of a connected neuron pair for various cycle numbers of data (blue lines). derived from the detailed model is also shown for comparison (dashed lines). The light blue zone represents the 95% confidence interval. The vertical scale is in rad/ms. The L2-distances were 0.0107, 0.0066, 0.0023, and 0.0021, for 100, 500, 1,000, and 5,000 cycles, respectively. (B) Similar to (A), except that this panel describes the results from an unconnected neuron pair. Since there was no interaction function for this neuron pair, the theoretically derived is represented by the flat dashed lines. The L2-distances were 0.0490, 0.0117, 0.0014, and 0.0002, for 100, 500, 1,000, and 5,000 cycles, respectively. (C) Comparison of the odd part of between the estimated and theoretically obtained functions. The filled circles indicate stable phase differences whereas the open circle shows an unstable phase difference. Although a discrepancy between the odd parts is seen, they have the same stable phase difference (Δϕ = 0). (D) Dependence of L2-distances on the variation of applied currents. The averages of L2-distance d1j (j = 2, 3, …, 64) were calculated with several numbers of cycles. Blue, red, and black lines indicate the results for 500, 1,000, and 5,000 cycles, respectively. σN was set to 0.4. (E) Dependence of L2-distances on the standard deviation of noise. The usage of colors is the same as in (D). σI was set to 0.1.

