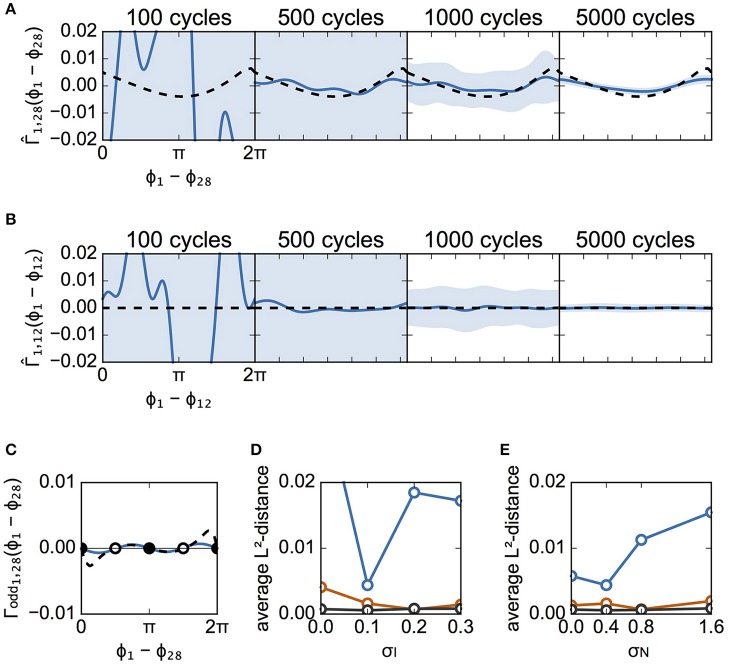
Figure 6.
Estimated interaction function for case B. This figure is similar to Figure 5, except that it describes the results from case B instead of case A. (A) The estimated interaction functions of a connected neuron pair for various cycle numbers of data (blue lines). The light blue zone represents the 95% confidence interval. derived from the detailed model is also shown for comparison (dashed lines). The L2-distances were 0.1235, 0.0044, 0.0016, and 0.0002, for 100, 500, 1,000, and 5,000 cycles, respectively. (B) The estimated interaction functions of an unconnected neuron pair. The L2-distances were 0.1261, 0.0062, 0.0015, and 0.0003, for 100, 500, 1,000, and 5,000 cycles, respectively. (C) Comparison of the odd part of between the estimated and theoretically obtained functions. As in Figure 5C, the filled circles indicate stable phase differences while the open circles show unstable phase differences. (D,E) Dependence of L2-distances on the standard deviation of applied currents and of noise. σN was set to 0.4 for (D), while σI was set to 0.1 for (E).

