
Figure 8.
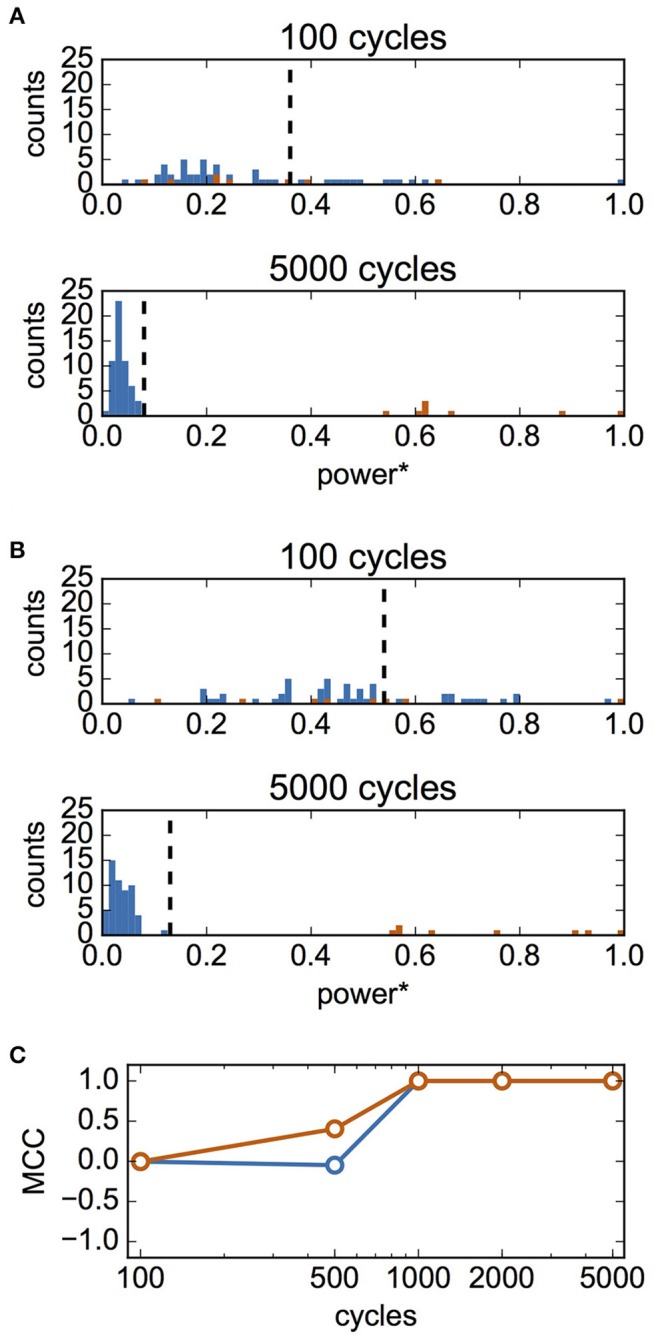
Inference of synaptic connections based on estimated interaction functions. In this analysis, σI and σN were set to 0.1 and 0.4, respectively. (A) Distributions of summed powers of for case A. The values were normalized using the maximum value, maxj(P1j). The upper panel shows the result for 100-cycle data, and the bottom panel shows that for 5,000-cycle data. Blue and red histograms display the distributions of unconnected neuron pairs and connected neuron pairs, respectively. The vertical dashed lines show the thresholds determined using Otsu's method. These lines were used as the thresholds for inference of the presence of synaptic connections. (B) Distributions of summed powers for case B. As in (A), the upper panel shows the result for 100-cycle data, and bottom panel shows that for 5,000-cycle data. (C) Matthew's correlation coefficient (MCC) for the inference of synaptic connections as a function of cycle number. Blue and red indicate MCC for case A and B, respectively.