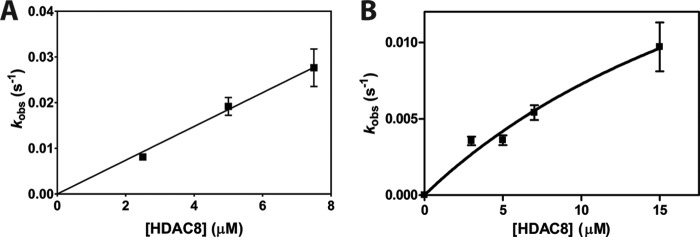
Figure 3.
Single turnover deacetylation of singly-acetylated H3 octamers. A, dependence of the apparent deacetylation rate constant of H3K9ac octamer on the concentration of HDAC8. Data points are from multiple measurements in a single reaction at each HDAC8 concentration, and error bars on kobs values represent errors calculated from the exponential fits. A linear fit of the data indicates that the kmax/K½ is 3,700 ± 100 m−1 s−1. B, dependence of the apparent deacetylation rate constant of H3K14ac octamer on the concentration of HDAC8. The data points are from multiple measurements in a single reaction at each HDAC8 concentration. A hyperbolic fit indicates that the kmax/K½ is 1,000 ± 200 m−1 s−1 with a kmax value of 0.03 ± 0.02 s−1.

