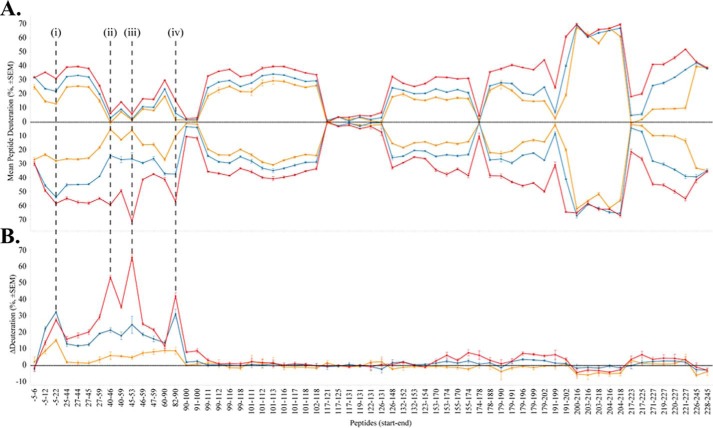
Figure 6.
Comparability profiles of HDX of wild-type versus D21N 14-3-3ζ. A, mirror plot for visual comparison of averaged deuteration of peptides detected from wild-type 14-3-3ζ (above the x axis) and D21N 14-3-3ζ (below the x axis). Each point represents a single peptide, and the orange, blue, and red lines represent 1-, 10-, and 60-min time points of HDX, respectively. Error bars, S.E. of triplicate determinations. B, the difference plot calculated from data in A indicates that the main difference in HDX regions is in the N-terminal peptides comprising the first 90 amino acids of the protein, especially peptides from helices αA, αC, and αD of D21N 14-3-3ζ. i–iv highlight the peptides showing the greatest difference in HDX between D21N and WT 14-3-3ζ.

