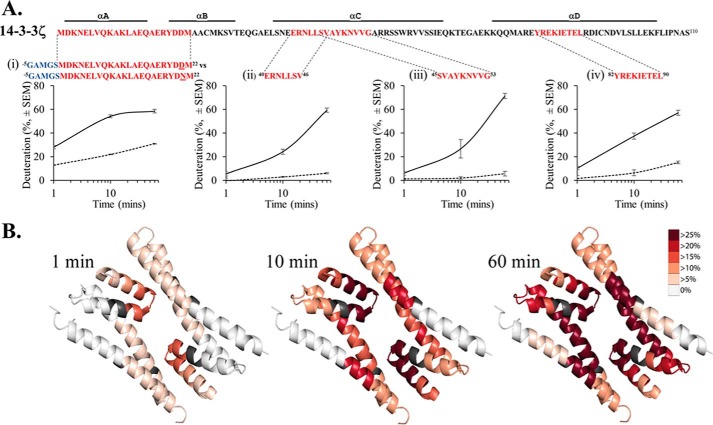
Figure 7.
HDX of selected N-terminal peptides of wild-type compared with D21N 14-3-3ζ. A, plots show the detail of time-dependent HDX of specific peptides (i–iv), as indicated in red on the primary sequence (and highlighted in Fig. 6). Dashed lines correspond to HDX for wild-type 14-3-3ζ, and solid lines are HDX for D21N 14-3-3ζ. The average and S.E. of triplicate determinations are shown. B, the ribbon diagrams show the comparative HDX of D21N 14-3-3ζ compared with wild-type 14-3-3ζ inferred for individual residues across the dimer interface (residues 1–110) at the three different time points (1, 10, and 60 min) and expressed using heat map coloring.

