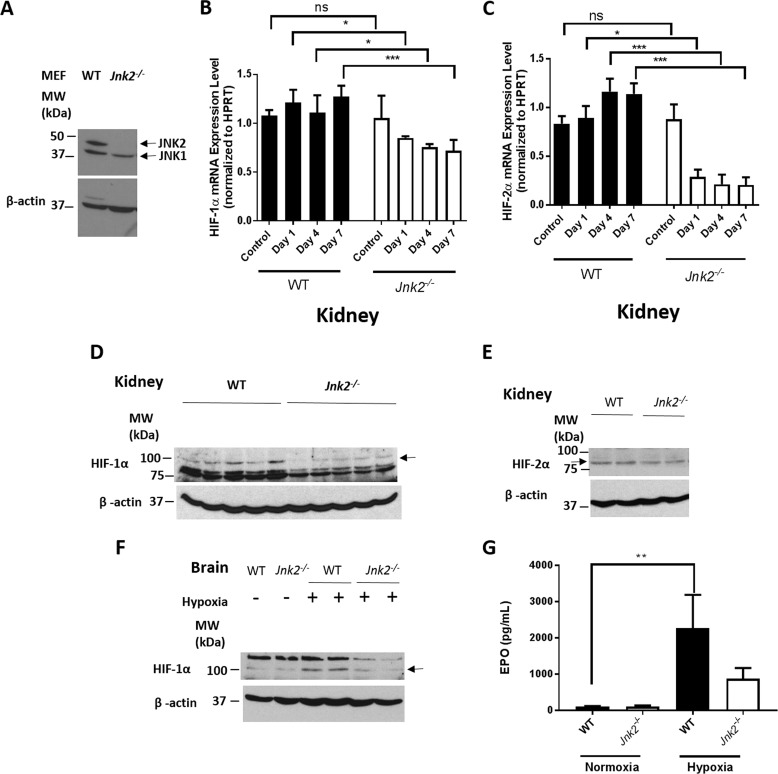
Figure 5.
JNK2 up-regulates the expression of the HIF target gene Epo. A, JNK1 and JNK2 immunoblots from WT and Jnk2−/− mouse whole-lung homogenates. The blot shown is representative of the results of n = 4 in each genotype. B, quantitative PCR for relative HIF-1α mRNA expression after normalizing to HPRT in mouse kidney homogenates after 0, 1, 4, or 7 days of hypoxia (7% oxygen). n = 5 in control group, and n = 3 in each hypoxia group. C, quantitative PCR for relative HIF-2α mRNA expression after normalizing to HPRT in mouse kidney homogenates after 0, 1, 4, or 7 days of hypoxia (7% oxygen). n = 5 in control group, and n = 3 in each hypoxia group. D, HIF-1α immunoblot of whole-kidney homogenates from WT or Jnk2−/− mice kept in hypoxic conditions (7% oxygen) for 7 days. E, HIF-2α immunoblot of whole-kidney homogenates from WT or Jnk2−/− mice kept in hypoxic conditions (7% oxygen) for 7 days. F, HIF-1α immunoblot of whole-brain homogenates from WT or Jnk2−/− mice kept in normoxic or hypoxic conditions (7% oxygen) for 7 days. G, EPO levels in the serum of WT or Jnk2−/− mice kept in normoxic conditions or hypoxic conditions (7% oxygen) for 7 days. Data are pooled from two independent experiments. n = 9 in the WT control group, n = 6 in the Jnk2−/− control group, n = 8 in WT hypoxia group, and n = 9 in Jnk2−/− hypoxia group. Immunoblots shown are representative of three independent experiments conducted with at least three mice in each group. All data are presented as mean ± S.E. (error bars). Statistical significance was determined by one-way ANOVA with Tukey's post hoc test (*, p ≤ 0.05; **, p ≤ 0.01; ***, p ≤ 0.001; ns, non-significant for the comparisons indicated by brackets).

