Figure 7.
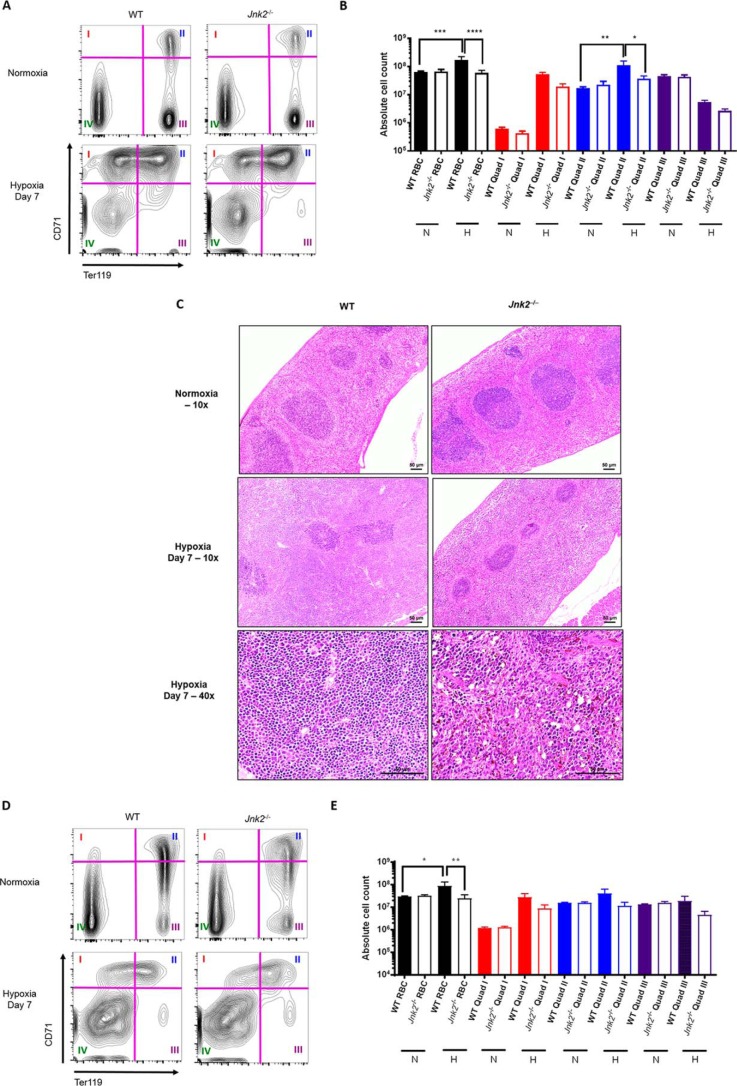
Jnk2−/− mice have decreased splenic erythropoiesis under hypoxic conditions. A, representative flow cytometry gating strategy for mouse spleen erythroid precursors. Quadrants were used to divide the cell populations into four groups representing progressive erythroid precursor differentiation (see “Results”). B, absolute counts of erythroid precursors in the spleen measured by flow cytometry in WT or Jnk2−/− mice after treatment with 7 days of hypoxia (7% oxygen) or kept in normoxic conditions. Data are pooled from two independent experiments. n = 5 in WT control group, n = 5 in Jnk2−/− control group, n = 5 in WT hypoxia group, and n = 9 in Jnk2−/− hypoxia group. C, representative H&E-stained sections of WT or Jnk2−/− mice spleens treated with hypoxia (7% oxygen) for 7 days or kept in normoxic conditions (×10 or ×40 magnification). D, representative flow cytometry gating strategy for mouse bone marrow erythroid precursors. Quadrants were used to divide the cell populations into four groups representing progressive erythroid precursor differentiation (see “Results”). E, absolute counts of erythroid precursors in the bone marrow measured by flow cytometry in WT or Jnk2−/− mice after treatment with 7 days of hypoxia (7% oxygen) or kept in normoxic conditions. Data are pooled from two independent experiments. n = 5 in WT control group, n = 5 in Jnk2−/− control group, n = 5 in WT hypoxia group, n = 9 in Jnk2−/− hypoxia group. N, normoxia; H, hypoxia; RBC, red blood cell content calculated as the sum of quadrants I, II, and III. All data are presented as mean ± S.E. (error bars). Statistical significance was determined by one-way ANOVA with Tukey's post hoc test (*, p ≤ 0.05; **, p ≤ 0.01; ***, p ≤ 0.001; ****, p ≤ 0.0001; ns, non-significant for the comparisons indicated by brackets).

