Figure 7.

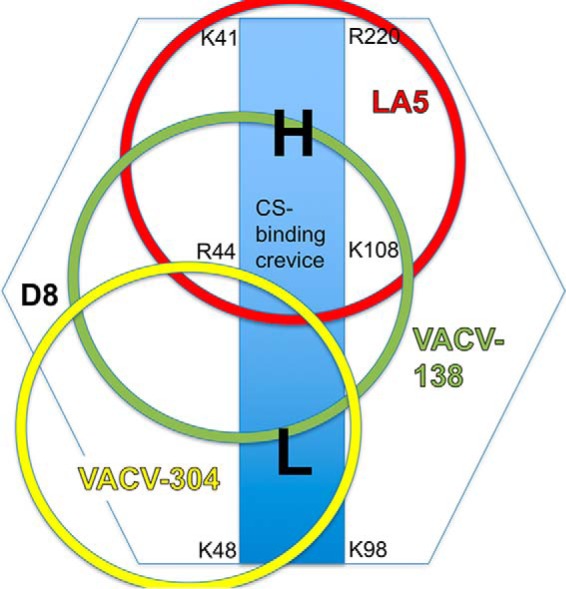
Footprint of CS-blocking mAbs on D8. Shown is a schematic representation of mAb binding sites (circles) and illustration of a high- (H) and low- (L) affinity binding region for CS within the central binding crevice (blue rectangle) of D8.

Footprint of CS-blocking mAbs on D8. Shown is a schematic representation of mAb binding sites (circles) and illustration of a high- (H) and low- (L) affinity binding region for CS within the central binding crevice (blue rectangle) of D8.