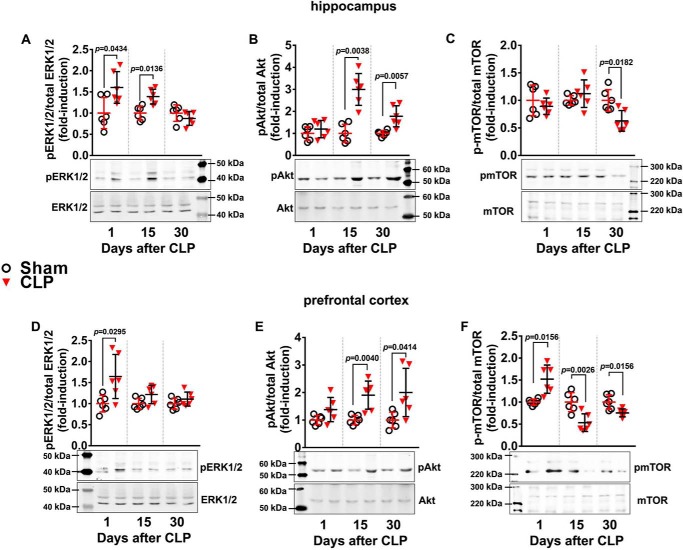
Figure 10.
ERK1/2, Akt, and mTOR phosphorylation in hippocampus and prefrontal cortex of animals at 1, 15, and 30 days after CLP. The phosphorylated levels of hippocampal ERK1/2 (A), Akt (B), and mTOR (C), and the phosphorylated levels of prefrontal cortex ERK1/2 (D), Akt (E), and mTOR (F) relative to their total respective protein levels were assessed by Western blotting. Scattered individual data points (n = 6) and standard deviation are represented for all data. Representative Western blots are demonstrated. Differences between sham and CLP groups in each day were considered significant when p < 0.05 according student's t test (two-tailed) analysis; individual p values are depicted.

