Figure 3.

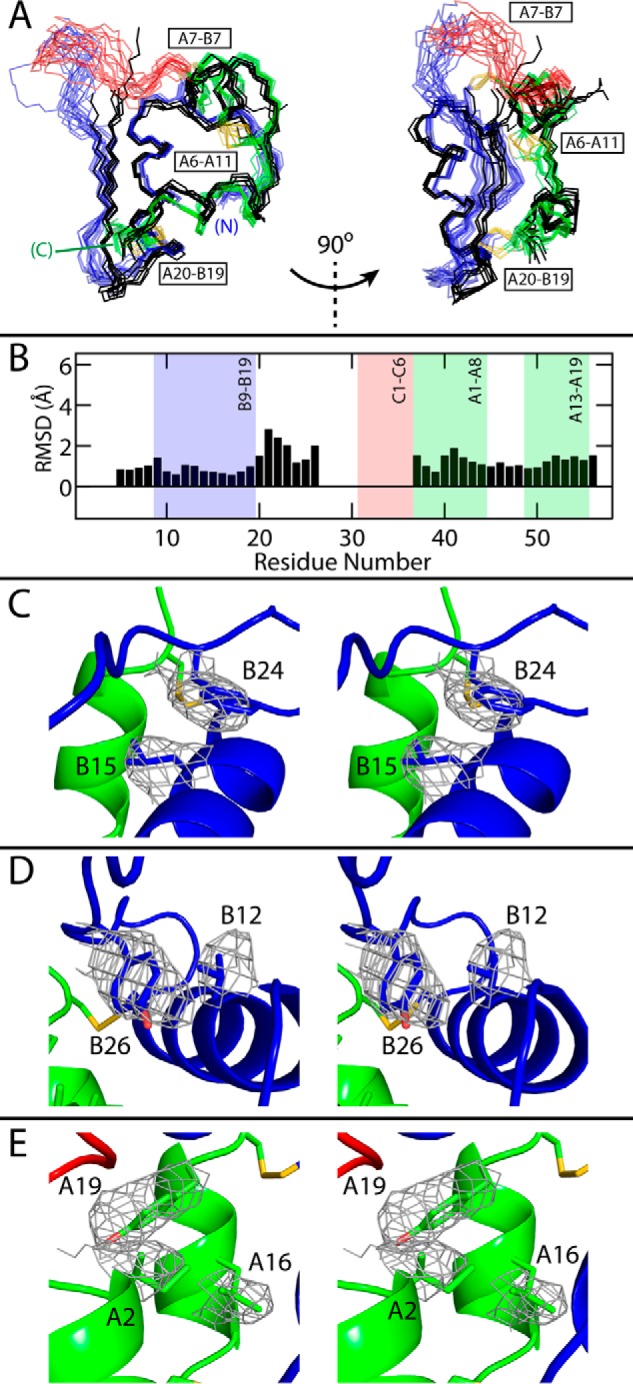
Comparison of SCI structures. A, backbone traces of 18 SCI-b NMR structures (with the A domain in green; B domain in blue; C domain in red; and disulfide bridges in yellow) with all six monomers of SCI-a (black, crystal refinement from accompanying article (9)); the structures were aligned as in Fig. 2. Two views are given at relative angle 90° to illustrate differences among B24–B30 segments. For clarity, SCI-b structures are at low opacity. B, average pairwise backbone r.m.s.d. comparing all monomers of SCI-a to 18 SCI-b structures. Absent r.m.s.d. values reflect residues with indeterminate electron densities. C–E, stereo models illustrating side-chain packing of residues B15 and B24 (C), B12 and B26 (D), and A2, A16, and A19 (E) within the mean SCI-b structure overlaid with the side-chain electron densities of SCI-a monomer D; structures were aligned as in Fig. 2 (SCI-a structure is hidden for clarity). Disulfide bridges are shown in yellow, and atoms otherwise colored by domain: A domain, green; B domain, blue; C domain, red; and atom colors: oxygen, light red; and nitrogen, light blue.
