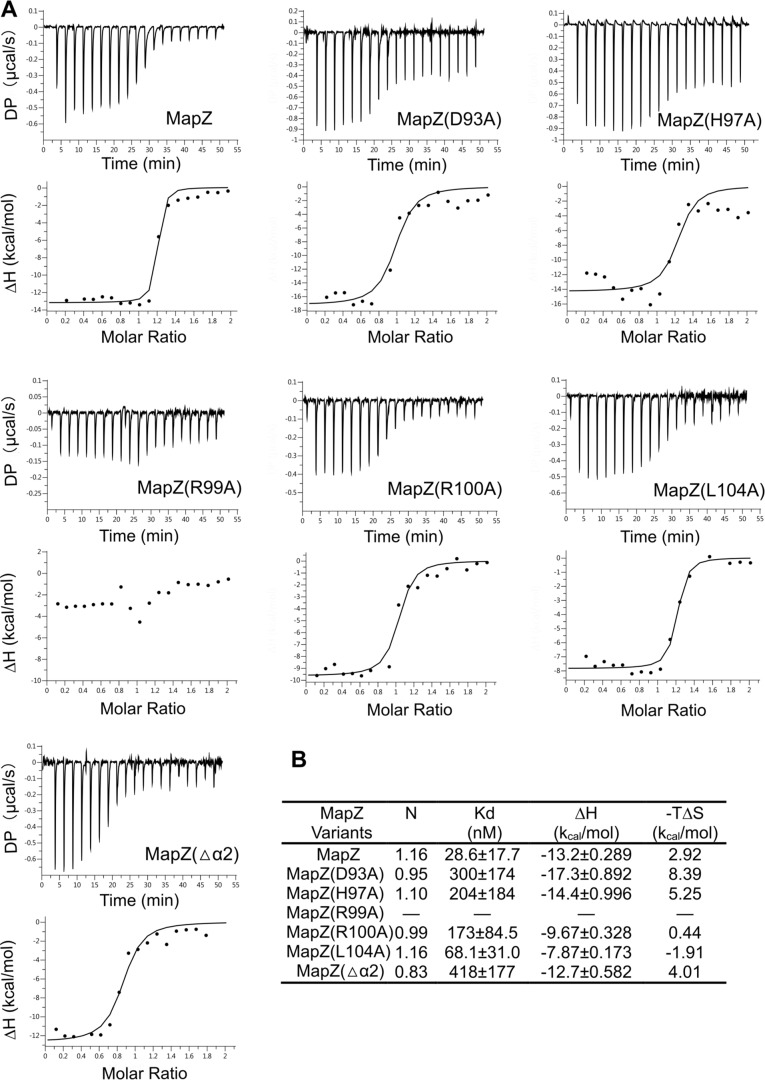
Figure 3.
Assessment of the contribution of the residues from helices α1 and α2 to protein-protein interaction by binding affinity measurement. A, binding isotherm (top panels) and data-fitting curves (bottom panels) obtained from ITC assay. Solution containing CheR1 was titrated into solution containing MapZ (or a mutant) and saturating c-di-GMP (250 μm). The experimental conditions are described under “Experimental procedures.” The binding measurements were performed in two independent experiments, and the representative data set is presented here. DP, differential power. B, apparent dissociation constant (Kd) values obtained by fitting the isotherm data to a 1:1 binding model.

