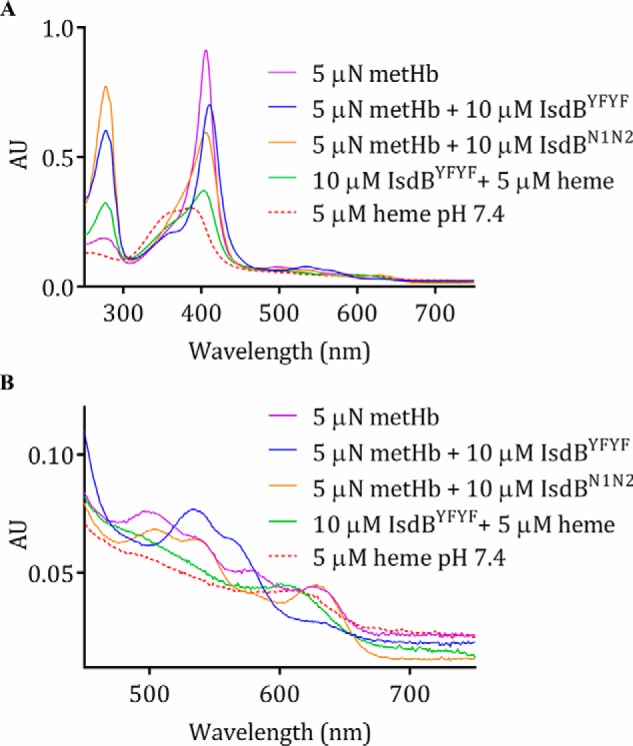
Figure 4.

Electronic spectra of IsdBYFYF combined with heme and Hb. A, addition of excess IsdBYFYF to metHb results in a distinctly altered spectrum (blue); the heme spectrum alone (red), metHb spectrum alone (purple), the mixture of IsdBYFYF with heme (green), and reaction of wild-type IsdBN1N2 with metHb (orange) are shown for comparison. AU, absorbance units. B, a closer look at the visible region of the spectra presented in A.
