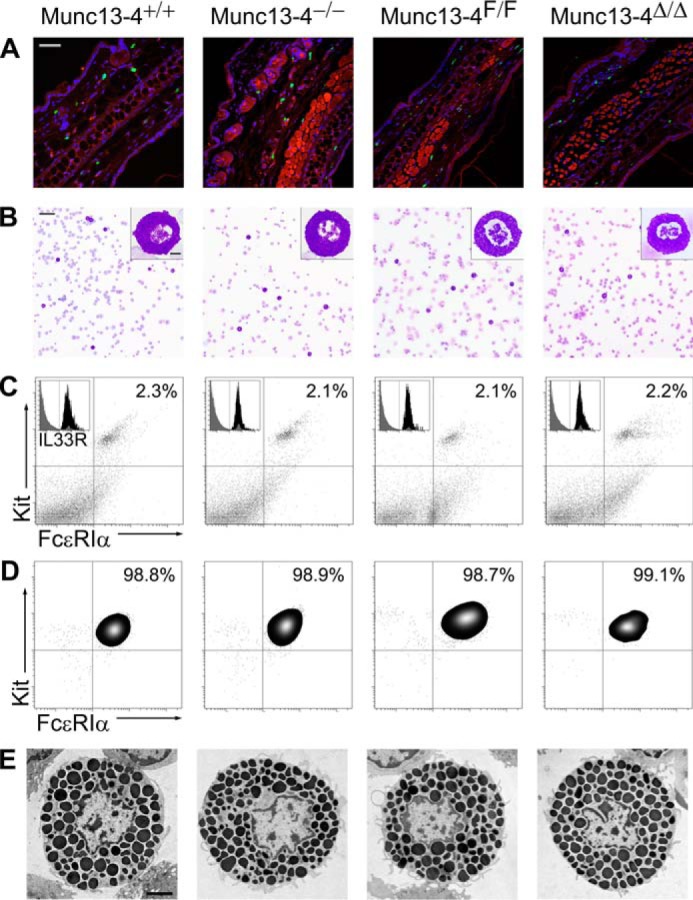
Figure 3.

Characterization of MCs from Munc13-4 mutant mice. Representative samples are shown: for detailed quantification please refer to Table 1. A, ear sections stained with FITC-avidin (green) and Hoechst (blue). MCs are identified as FITC+ granules surrounding Hoechst+ nuclei; cartilage and epithelial autofluorescence in the red channel delimited the dermis. Scale bar = 100 μm. B, Wright-Giemsa staining of peritoneal lavages. MCs are identified by their metachromatic granules. Scale bar = 80 μm, inset scale bar = 5 μm. C, flow cytometry of peritoneal lavage cells labeled for Kit and FcϵRIα. MCs are identified as Kit+/FcϵRIα+ double-positive cells. Inset, Kit+/FcϵRIα+ double-positive cells before (gray) and after (black) adding labeled anti-IL33R antibody. D, flow cytometry of BMMCs after 6 weeks in media enriched with SCF and IL3 labeled for Kit and FcϵRIα. E, EM cell profiles of peritoneal MCs used for stereology. Scale bar = 4 μm.
