Figure 6.

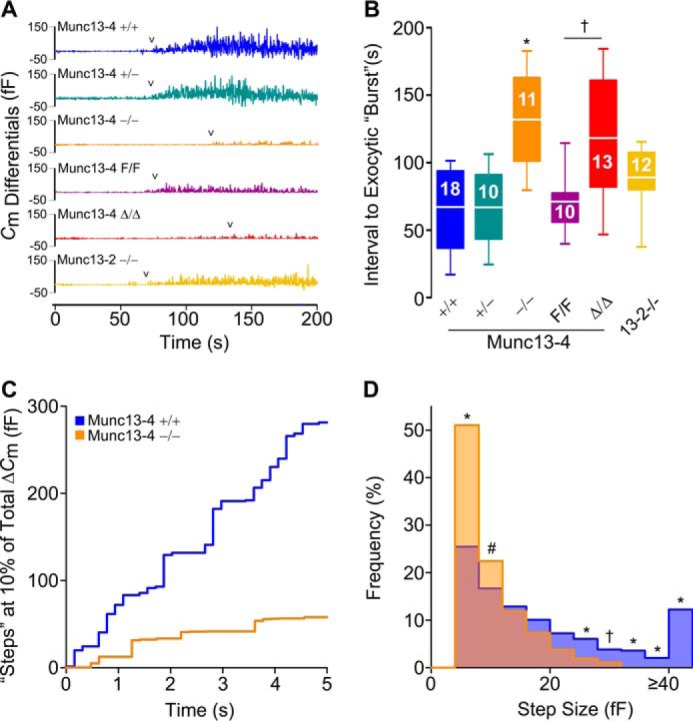
Munc13-4 regulates the start of exocytosis and the size of the steps in Cm. A, representative Cm differentials from Cm traces shown in Fig. 5A. 0, time of cell access; arrowheads, first Cm differential ≥8 fF. Color legend applies to A and B. B, interval between start of dialysis of GTPγS and Ca2+ and beginning of the exocytic burst. Line, mean; box, 25th–75th percentile; whiskers, 5th–95th percentile; n = number inside boxes. C, representative Cm traces at ∼10% of total ΔCm. Signals <0 fF have been removed for clarity. Color legend applies to C and D. D, histogram of Cm step sizes between 1 and 15% of total ΔCm. Signals <4 fF have been removed for clarity. n = numbers in B; ∼68 steps/cell. # = p < 0.05, † = p < 0.01, and * = p < 0.001; all comparisons are to Munc13-4+/+ unless otherwise indicated.
