Figure 8.
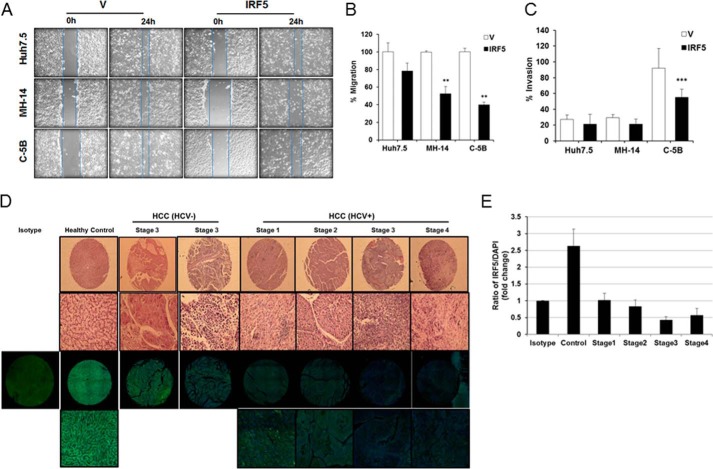
IRF5 inhibits the migration and invasion potential of HCV replicon cells. A, wound-healing assays were performed on Huh7.5, MH-14, and C-5B cells after transient transfection with empty vector (V) or GFP-IRF5 plasmid. Representative images are shown from 0 and 24 h after scratch. Lines demarcate visible wound borders. B, graphical representation of data from the 24-h time point is shown from four independent experiments performed in duplicate. Plotted values are means ± S.D. (error bars) (**, p < 0.001). C, similar to A except Matrigel invasion assays were performed on the indicated cell lines 16 h post-transfection. Graphical representation of data is shown from three independent experiments performed in duplicate. Plotted values are means ± S.D. (***, p < 0.0001). D, IRF5 expression is lost in the livers of HCV-positive HCC patients. Representative H&E and immunofluorescence staining of individual cores from a human liver cancer tissue array is shown. Representative images are from n = 20 healthy liver, n = 20 HCV- and HBV-negative HCC, and n = 18 HCV-positive HCC tissue cores. The top two panels show results from H&E staining; the top panel shows full core (×4 magnification), and the bottom panel shows a ×20 magnified image. The bottom two panels show immunofluorescence staining at the same magnifications; IRF5 is Alexa Fluor 488 (green), DAPI is blue. Left, single panel shows negative isotype control staining for IRF5 in healthy control core. E, summarized data of IRF5 expression is from n = 20 healthy liver and n = 38 HCC tissue cores stained in D. The ratio of IRF5 to DAPI staining is plotted for each disease stage.

