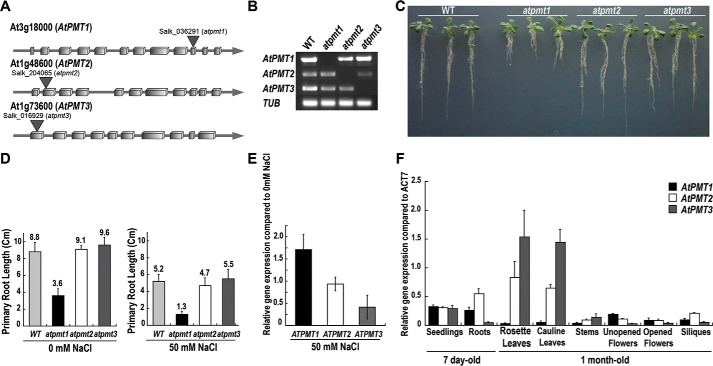
Figure 2.
Comparison of atpmt T-DNA knock-out mutants and tissue-specific expression of AtPMT isoforms. A, schematic of the genomic structures of atpmt1, atpmt2, and atpmt3 with T-DNA insertion sites indicated. Boxes represent exons, and the lines represent introns. B, RT-PCR analysis of homozygous mutant plants using AtPMT isoform-specific primers. β-Tubulin (TUB) was used as a control. C, effect of T-DNA knock-out on root length. Wild-type, atpmt1, atpmt2, and atpmt3 A. thaliana seedlings were grown for 10 days on half-strength MS agar plates and photographed. D, effect of T-DNA knock-out on salt tolerance. As in C, seedlings were grown for 10 days on half-strength MS agar plates ± 50 mm NaCl, and then primary root length was determined. Error bars represent the standard error of the mean (n = 25). E, effect of NaCl treatment on atpmt1–3 expression. Wild-type A. thaliana seedlings were grown as in D. Total RNA was extracted from 7-day-old seedlings for qRT-PCR amplifications. Relative expression values for atpmt1 (black), atpmt2 (white), and atpmt3 (gray) in NaCl-untreated and -treated seedlings were normalized against tub gene expression. Error bars are the standard error of the mean (n = 3). F, tissue-specific expression of AtPMT isoforms. Total RNA was extracted from 7-day-old seedlings and 1-month-old plant tissues. The qRT-PCR amplifications were performed in triplicate independently for each target gene and the data averaged. The relative expression values for atpmt1 (black), atpmt2 (white), and atpmt3 (gray) in different tissues were normalized against act7 gene expression. Error bars represent the standard error of the mean (n = 6).

