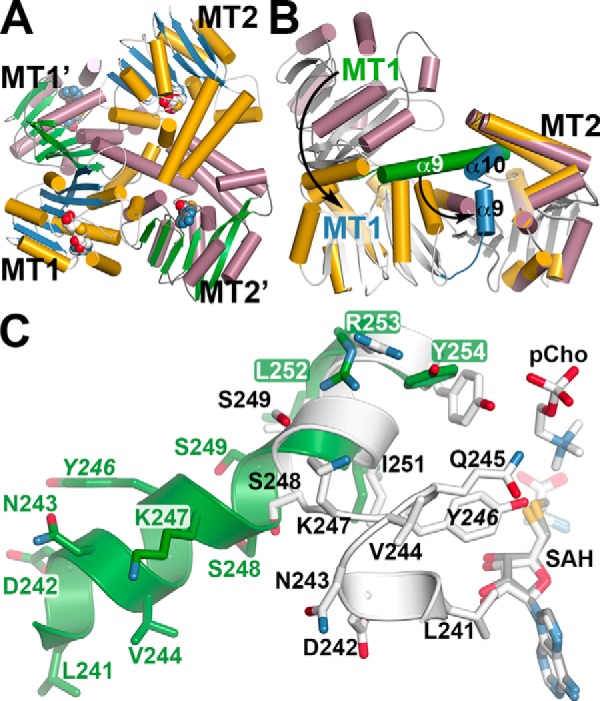
Figure 4.

Crystal structure of AtPMT2 and conformational changes in di-domain architecture. A, domain-swapped organization of the MT1 and MT2 domains of AtPMT2. The ribbon diagram shows the arrangement of each domain in two distinct AtPMT2 molecules. For one AtPMT2 molecule, α-helices as gold cylinders and β-strands as blue arrows with each domain labeled (MT1 and MT2) are shown. The α-helices and β-strands of the second AtPMT2 molecule are shown as rose cylinders and green arrows, respectively, with each domain labeled (MT1′ and MT2′). B, comparison of MT1 and MT2 domain positions in AtPMT1 and AtPMT2. The MT2 domains of AtPMT1 (colored gold) and AtPMT2 (colored rose) were overlaid to highlight the movement of the MT1 domain between the two structures. The α9-helix of AtPMT1 is colored green with the corresponding α9 and α10 helices of AtPMT2 colored blue. Arrows emphasize the rearrangements between the two structures leading to active-site formation in the MT2 domain. C, details of the structural transition in the di-domain linker helix. A section of the extended structure of α9 (Leu-241–Tyr-254) in AtPMT2 is shown in green. The position of SAH in the AtPMT2 MT2 active site is shown as a stick model (gray). Portions of α9 (Leu-241–Asn-243), the active-site loop (Val-244–Ser-248), and α10 (Ser-249–Tyr-254), along with SAH and pCho, in AtPMT1 are shown in white stick models.
