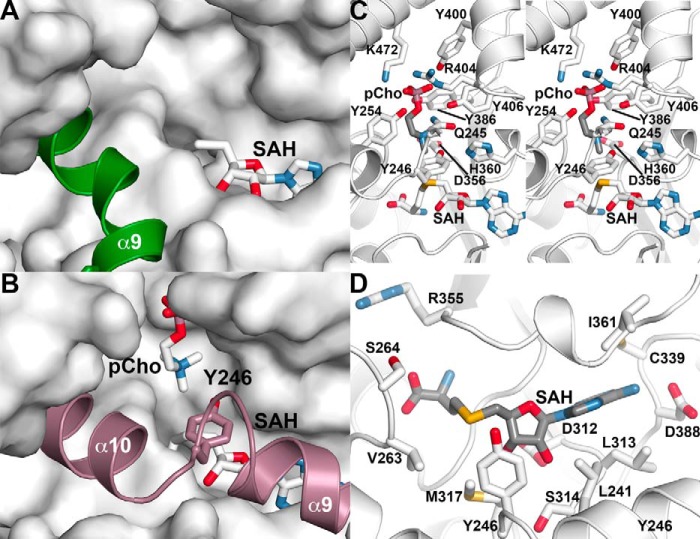
Figure 5.
Structure of the MT2 domain active site. A, open MT2 domain active site in the AtPMT2·SAH complex structure. The surface view shows the MT2 domain active site with bound SAH (stick model). The α9 linker helix, which is extended in this structure, is shown as a green schematic. B, closed MT2 domain active site in the AtPMT1·SAH·pCho complex structure. The surface view shows the MT2 domain active site with bound pCho and SAH (stick models). The α9- and α10-helices, along with Tyr-246 (stick model), are shown in rose. C, MT2 domain SAH/SAM-binding site in the AtPMT1·SAH·pCho complex structure. Secondary structure features are shown in white with side chains contacting SAH shown as stick models. D, stereo view of the MT2 domain phosphobase-binding site in the AtPMT1·SAH·pCho complex structure. The view shows secondary structure as white ribbon diagrams with side chains contacting pCho shown as stick models.

