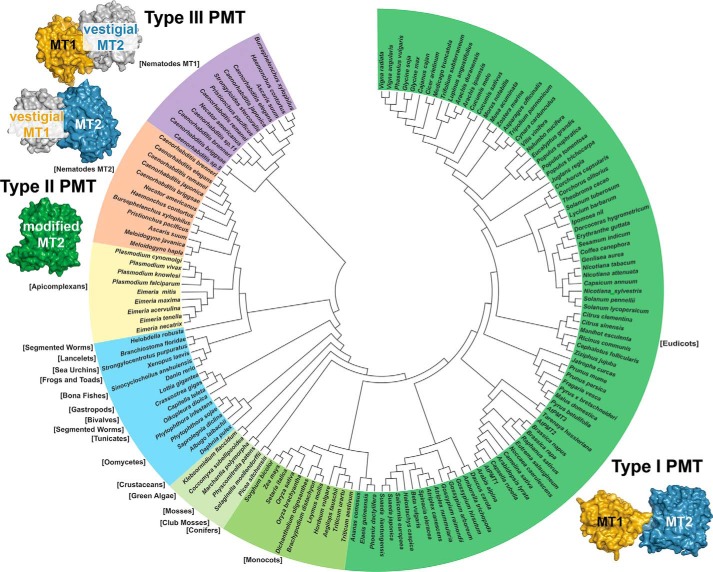
Figure 8.
Evolutionary relationships of PMT sequence and structure. The phylogenetic tree was generated with MEGA5 (49) with evolutionary relationships inferred using the Neighbor-Joining method (50). The bootstrap consensus tree was inferred from 100 replicates and taken to represent the evolutionary history of the taxa analyzed (51). Evolutionary distances were computed using the JTT matrix-based method (52). The analysis included 153 amino acid sequences (supplemental Table S1). Schematic images of the type I PMT from plants, type II PMT from Plasmodium, and the type III PMT from nematodes are shown to highlight changes in domain organization and function.

