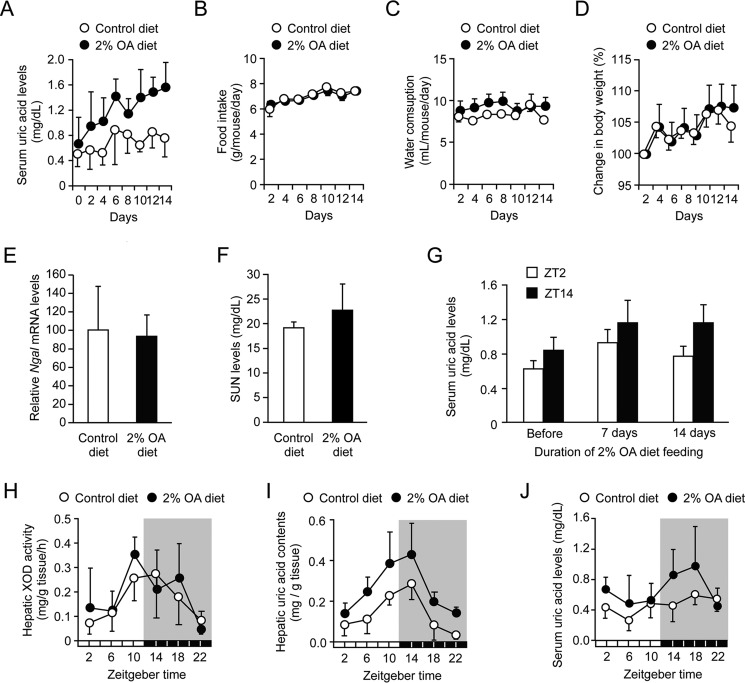
Figure 4.
Characterization of hyperuricemia model mice. A–D, time course of serum uric acid levels (A), food intake (B), water consumption (C), and body weight (D) in mice during the feeding of a 2% OA-containing diet. Each value represents the mean ± S.D. (n = 6–7). E and F, the renal expression of neutrophil gelatinase-associated lipocalin-2 (Ngal) mRNA (E) and SUN concentrations (F) in mice after feeding of the 2% OA-containing diet for 14 days. Each value represents the mean ± S.D. (n = 6–7). G, temporal profiles of serum uric acid levels in mice during feeding of the 2% OA-containing diet. Blood samples were collected at ZT2 and ZT14 on the indicated day. Each value represents the mean ± S.D. (n = 3). H, temporal profiles of XOD activity in the livers of mice after feeding the 2% OA-containing diet for 14 days. Each value represents the mean ± S.D. (n = 3). I, temporal profiles of uric acid contents in the livers of mice after feeding the 2% OA-containing diet for 14 days. Each value represents the mean ± S.D. (n = 3). There was a significant time-dependent variation in the hepatic contents of uric acid in mice fed the control diet (F5,12 = 6.884, p = 0.003; ANOVA) and 2% OA-containing diet (F5,12 = 4.638, p = 0.014; ANOVA). J, temporal profiles of serum uric acid levels in mice after feeding of the 2% OA-containing diet for 14 days. There were significant time-dependent variations in serum uric acid levels in mice fed the control diet (F5,30 = 2.994, p = 0.026; ANOVA) and those fed the 2% OA-containing diet (F5,36 = 2.907, p = 0.026; ANOVA).

