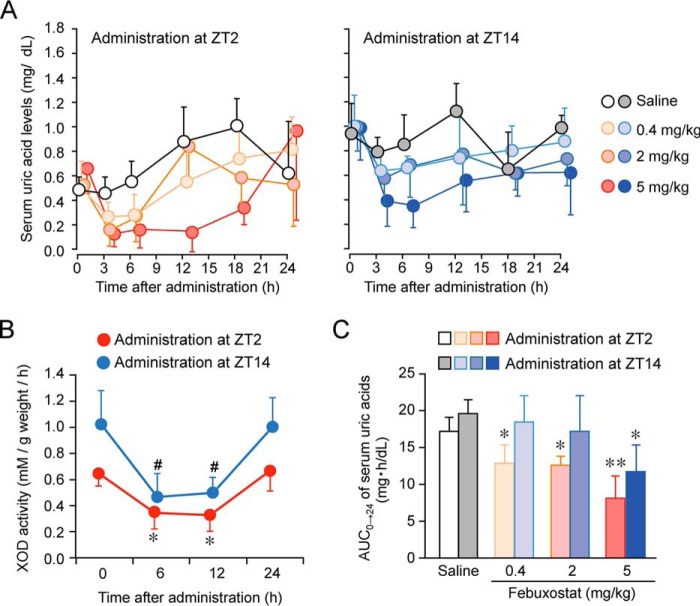
Figure 5.
Dosing time–dependent differences in the ability of febuxostat to decrease serum uric acid levels in chronic hyperuricemia model mice. A, time course of serum uric acid levels in chronic hyperuricemia mice after the intraperitoneal administration of 0.4, 2, or 5 mg/kg febuxostat at ZT2 or ZT14. Each value represents the mean ± S.D. (n = 4–5). B, time course of the inhibitory effects of febuxostat (5 mg/kg, i.p.) on XOD activity in the livers of mice after its administration at ZT2 and ZT14. Each value represents the mean ± S.D. (n = 4). *, p < 0.05; #, p < 0.05, significant difference from the basal level (time = 0) in the corresponding group (F3,12 = 7.904, p = 0.003 for the ZT2 administration group; F3,11 = 9.203, p = 0.002 for the ZT14 administration group, ANOVA with Tukey-Kramer post hoc test). C, the value of AUC0→24 in chronic hyperuricemia mice after the intraperitoneal administration of 0.4, 2, or 5 mg/kg febuxostat at ZT2 or ZT14. Each value represents the mean ± S.D. (n = 4–5). **, p < 0.01; *, p < 0.05, significant difference from the saline-treated groups at the corresponding dosing time (F3,13 = 15.888, p < 0.001 for the ZT2 administration group; F3,13 = 3.803, p = 0.037 for the ZT14 administration group, ANOVA with Tukey-Kramer post hoc test).

