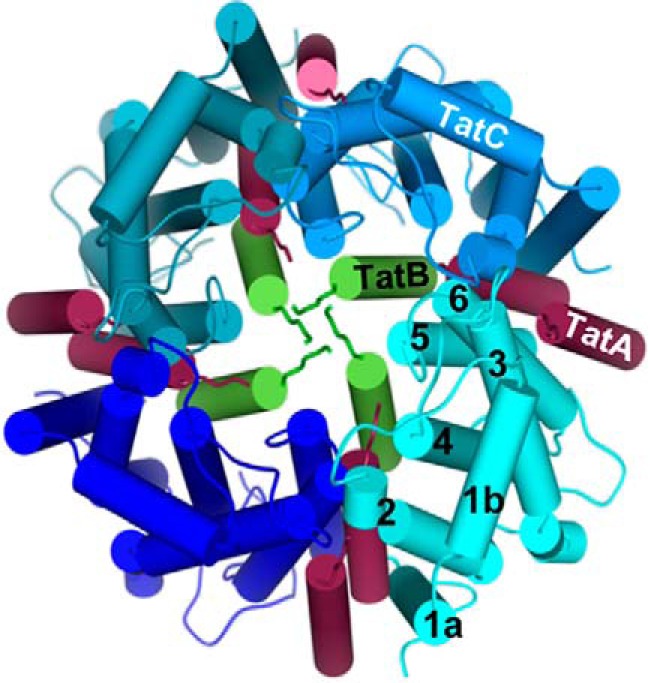
Figure 1.

Model of the Tat translocase. The hexahelical X-ray crystallographic structures of four TatC monomers are shown in different shades of blue with the six transmembrane helices numbered for the monomer shown in cyan. A tetrameric structure was chosen for reasons of clarity, whereas experimental data for higher order assemblies have been provided. The isolated transmembrane helices of four TatB molecules (green) and eight TatA molecules (red) were modeled against the TatC structure according to experimentally verified contact sites. The side-by-side arrangement of two neighboring TatC monomers is also derived from cross-linking studies. View is from the trans-side down the membrane normal with substrates (not shown) approaching from below.
