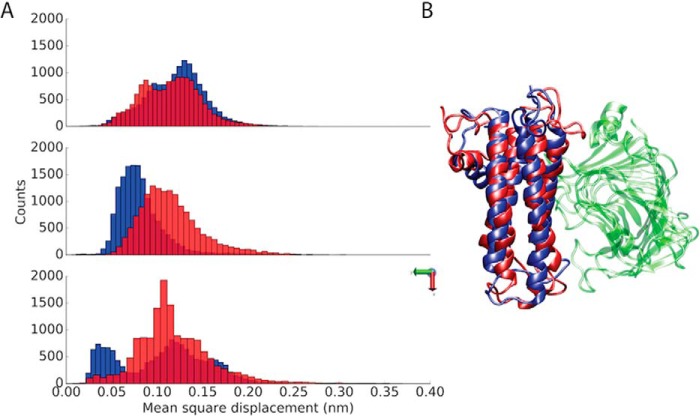
Figure 1.
Stability of the AtPME3–AtPMEI7 complex at acidic and neutral pH. A, distributions of the MSD for AtPMEI7 bound to AtPME3 at pH 5 (blue) and pH 7 (red). The MSD is shown in the three dimensions. B, the average conformations of the AtPMEI7 bound to AtPMEI3 at pH 5 (blue) and pH 7 (red) is shown, with the proteins depicted using a cartoon representation.

