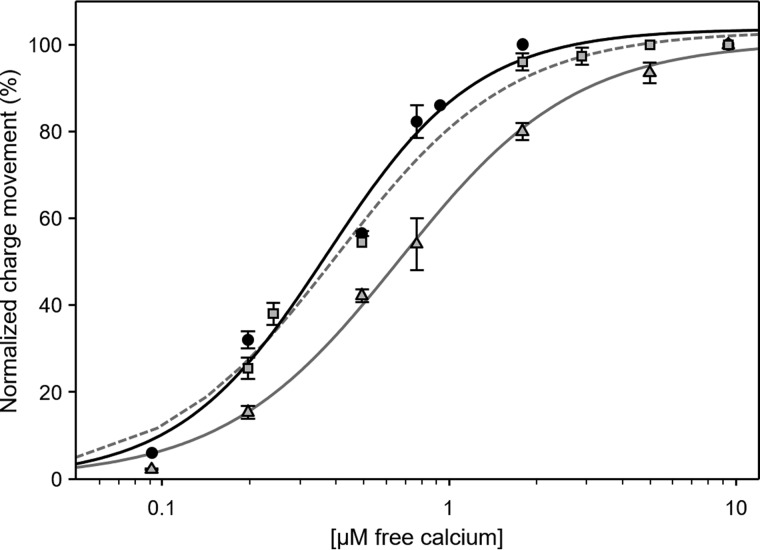
Figure 4.
SERCA charge translocation as a function of Ca2+ concentration in the presence of PLN or SLN. Normalized charges related to ATP concentration jumps on proteoliposomes containing SERCA (circles; black line), SERCA + PLN (triangles; gray line), or SERCA + SLN (squares; gray dashed line) in the presence of various Ca2+ concentrations are shown. Values are normalized with respect to the charge obtained following a 100 μm ATP jump in the presence of 10 μm free Ca2+. The lines represent curve fitting of the experimental data using the Hill equation (kinetic parameters can be found in Table 1). Error bars represent S.E. of at least four independent measurements.

