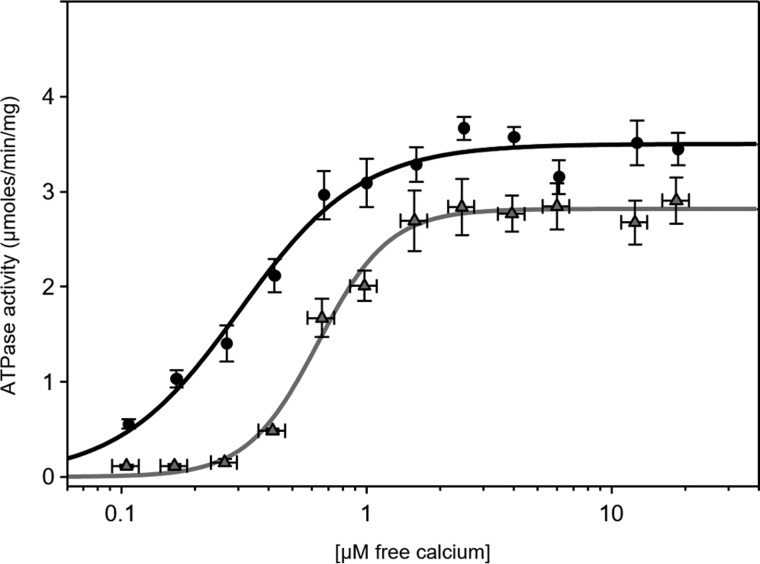
Figure 7.
ATPase activity as a function of Ca2+ concentration for SERCA (circles) and SERCA + PLN (triangles) proteoliposomes. To mimic physiological resting-state conditions, the proteoliposomes were preincubated with 0.06 μm calcium and 4 mm ATP. SERCA ATPase activity was initiated by the addition of the remaining calcium required to achieve 0.1–10 μm free calcium. The lines represent curve fitting of the experimental data using the Hill equation (kinetic parameters can be found in Table 1). Each data point is the mean ± S.E. (n ≥ 4). Error bars represent S.E.

