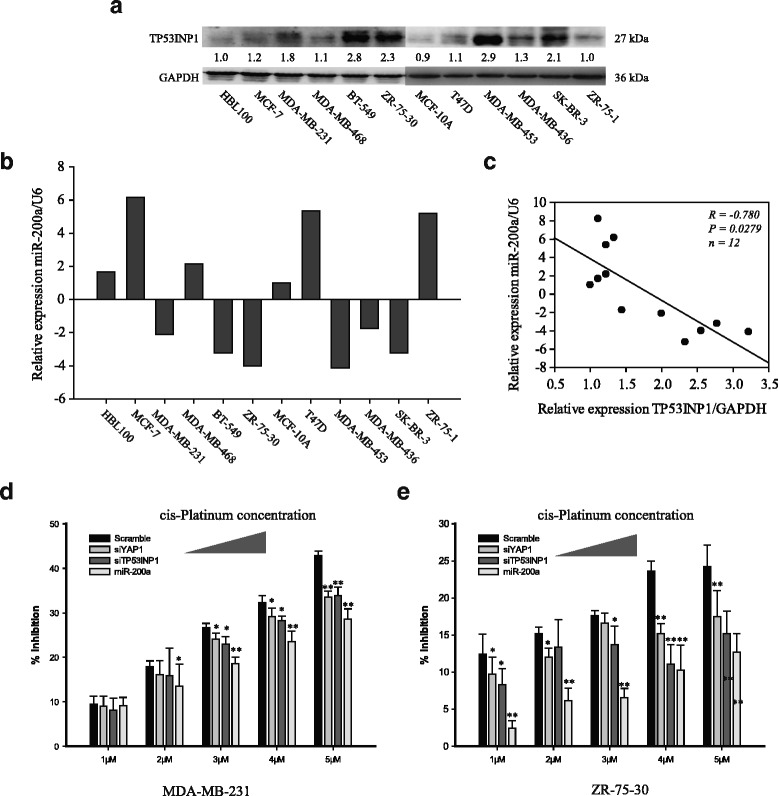
Fig. 6.

miR-200a expression is inversely correlated with TP53INP1 expression in breast cancer tissue. a Western blot analysis of TP53INP1 protein expression. b relative expression levels of miR-200a in human breast cancer cell lines. c Pearson correlation of the TP53INP1 and miR-200a expression levels in breast cancer cell lines (R = −0.780, P = 0.0279, n = 12). Inhibition ratio of scramble RNA, siYAP1, siTP53INP1 and miR-200a mimic transfected MDA-MB-231 (d) and ZR-75-30 (e) after treating with cis-platin 72 h. The cis-platin concentrations were 1 μM, 2 μM, 3 μM, 4 μM, and 5 μM, respectively. *p < 0.05; **p < 0.01
