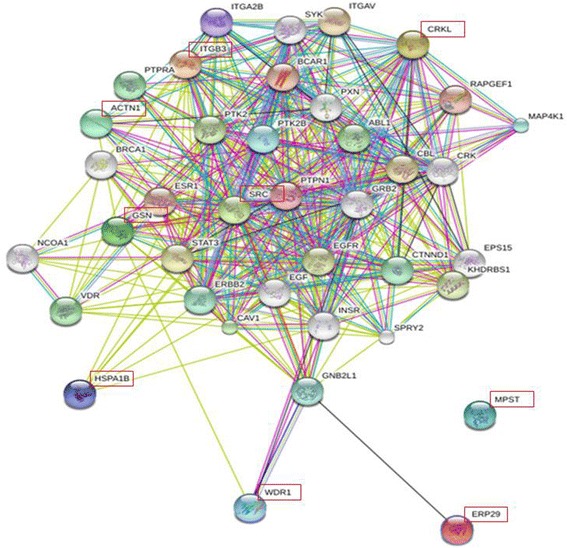
Fig. 4.

Functional interaction profile of identified platelet proteins [36]. Lines represent interaction, where thick lines suggest a substantial number of references, thin lines correspond to single studies, arrows point the direction of activation influence, and block signs describe inhibitory actions
