Fig. 1.

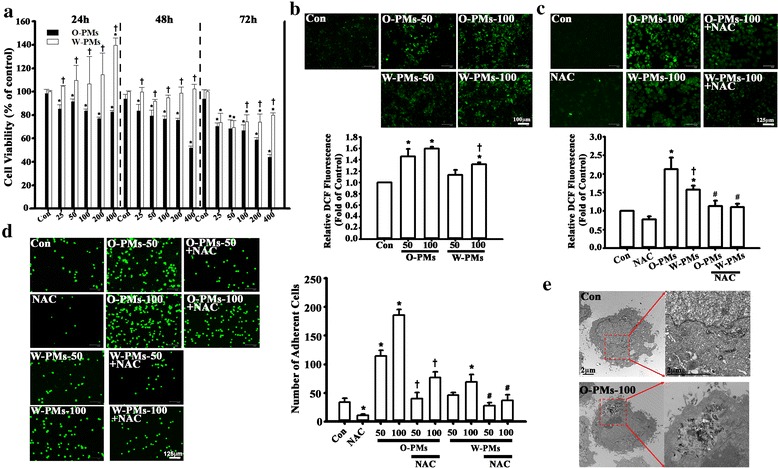
Cytotoxicity, ROS generation, and monocyte adherence to A549 cells were more severely affected by O-PM than by W-PM treatment. a The cytotoxic effects of O-PMs (organic solvent-extractable fraction of PMs) and W-PMs (water-soluble fraction of PMs) on A549 cells at the concentrations of 25, 50, 100, 200, and 400 μg/ml for 24, 48 and 72 h were examined by MTT assay. The data are expressed as a percentage of that obtained for DMSO-treated or media-treated cells, which was set to 100%. *p < 0.05 vs. the control cells in the corresponding groups. †p < 0.05 vs. O-PMs. b The intracellular ROS levels in A549 cells after the exposure of 50 or 100 μg/ml of O-PMs or W-PMs for 24 h were determined using DCFH-DA by fluorescent microscope and flow cytometer. Bar = 100 mu. c A549 cells were pretreated with 5 mM of N-acetyl cysteine (NAC) for 1 h and then treated with 100 μg/ml of O-PMs or with W-PMs for 24 h. The intracellular ROS levels were determined using DCFH-DA by fluorescent microscope and flow cytometer. Bar = 125 mu. d Representative fluorescence photomicrographs and quantitative data showing the effect of O-PMs and W-PMs-treated A549 cells on the adhesion of fluorescein-labeled U937 cells. A549 cells were treated with or without 5 mM NAC for 1 h, and were then treated with or without 50 or 100 μg/ml of O-PMs or W-PMs for 24 h. The number of bound U937 cells was counted by fluorescence microscopy. Values are the mean ± SD of three independent experiments. *p < 0.05 vs. con. †p < 0.05 vs. O-PMs-50 or O-PMs-100, respectively. #p < 0.05 vs. W-PMs-50 or W-PMs-100, respectively. Bar = 125 mu. e TEM images of A549 cells. O-PMs were located in the cytoplasm of A549 cells after 100 μg/ml O-PMs exposure for 24 h. Bar = 2 mu
