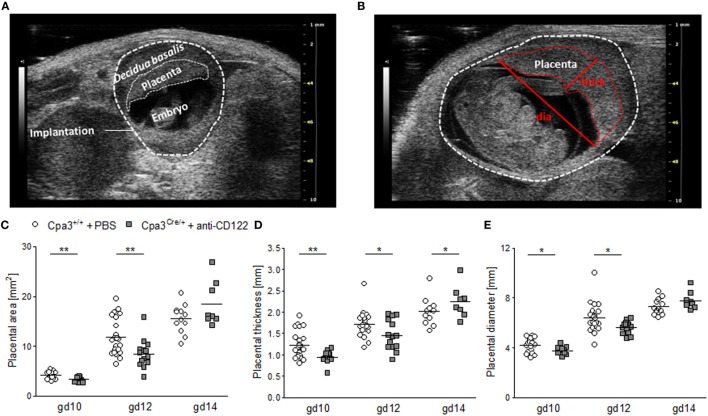
Figure 2.
Placental measurements at gd10, 12, and 14. (A) Representative ultrasound image of a WT implantation at gd10 showing the decidua basalis, the placenta, and the embryo. (B) Representative ultrasound image of a WT implantation at gd12 showing placental thickness (thick) and placental diameter (dia). Placental area (C), placental thickness (D), and placental diameter (E) from WT Cpa3+/+ + PBS mice (mice n = 3–5, placentas n = 12–22 per day) and MC/NK-deficient Cpa3Cre/+ + anti-CD122 mice (mice n = 3–4, placentas n = 8–14 per day) at gd10, 12, and 14. Results are presented as individual values for each single placenta and mean. Statistical differences were obtained using unpaired t-test (*P < 0.05, ** P < 0.01). gd, gestation day; WT, wild type; thick, thickness; dia, diameter; MC, mast cell; NK, natural killer cell.

