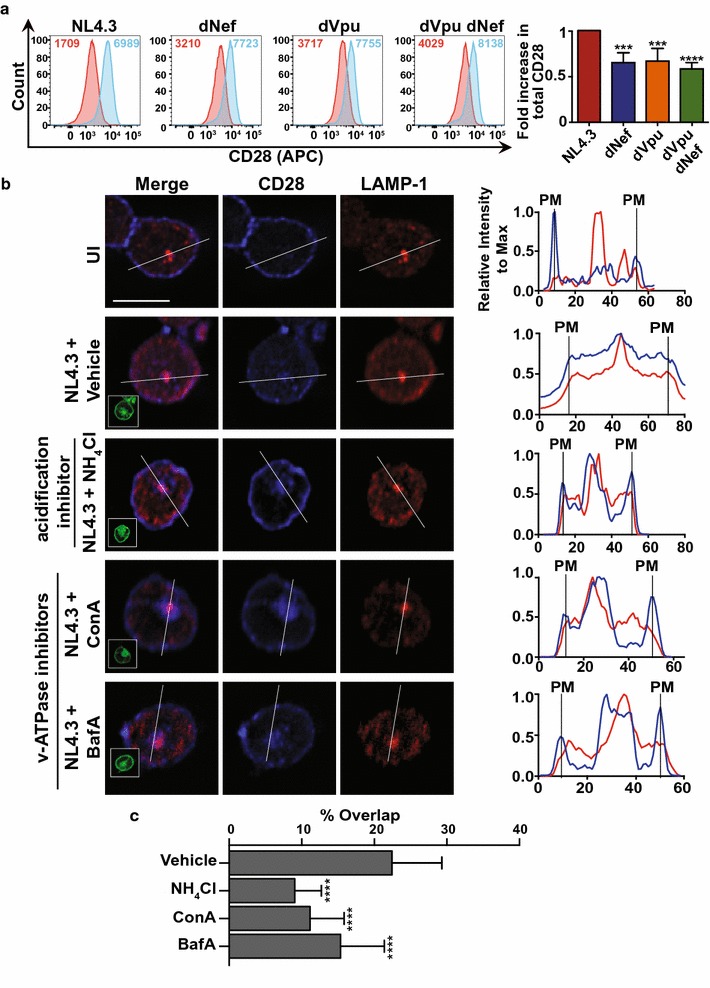
Fig. 4.

Inhibition of the degradation machinery increases CD28 protein levels in infected cells. CD4+ Sup-T1 cells were infected with VSV-G pseudotyped NL4.3 encoding or lacking Nef and/or Vpu. Infected cells were analyzed 48 h post-infection after treatment for 24 h with 40 mM ammonium chloride or treatment for 5 h with 100 nM Bafilomycin A1 or 100 nM Concanamycin A. Cells were stained for CD28 and the lysosomal marker LAMP-1 and analyzed by widefield microscopy or stained for CD28 and analyzed by flow cytometry. a Representative histograms illustrating total CD28 levels of infected cells treated with complete RPMI with (blue) or without (red) 40 mM ammonium chloride. Geometric mean fluorescence intensities (MFIs) are indicated. MFIs of infected cells were determined after gating on live (Zombie RedTM−), infected (GFP+) cells and the relative fold increase (± SE) in total CD28 upon ammonium chloride (n ≥ 5) treatment is illustrated (right). b Representative infected (GFP+) Sup-T1 cells subjected to treatment with vehicle (DMSO), ammonium chloride (NH4Cl), Concanamycin A (ConA) or Bafilomycin A1 (BafA) and visualized by widefield microscopy (left). The scale bar indicates 10 μm and insets in merged panel illustrate GFP channel. A graphical representation of CD28 and LAMP-1 fluorescence intensity relative to max along the illustrated line is shown (right). The vertical lines labelled PM indicate where the illustrated line meets the plasma membrane (PM). c The percentage of overlap between CD28 and LAMP-1 is based on the mean (± SD) Manders’ overlap coefficients measured on at least 30 cells from 3 independent experiments (UI: uninfected; SD: standard deviation; LAMP-1: Lysosomal-associated membrane protein; MFI: geometric mean fluorescent intensity; ***p ≤ 0.001; ****p ≤ 0.0001)
