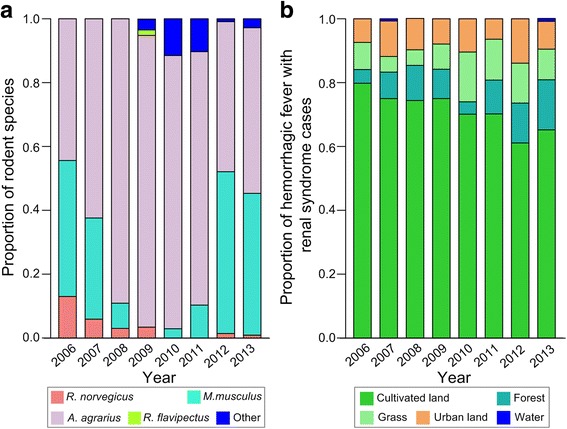
Fig. 2.

Visualized coefficient matrix showing the relationships among rodent community composition, land use types and HFRS occurrence in (a) Loudi, (b) Shaoyang. The coefficient values are color coded from blue (low values) to red (high values)

Visualized coefficient matrix showing the relationships among rodent community composition, land use types and HFRS occurrence in (a) Loudi, (b) Shaoyang. The coefficient values are color coded from blue (low values) to red (high values)