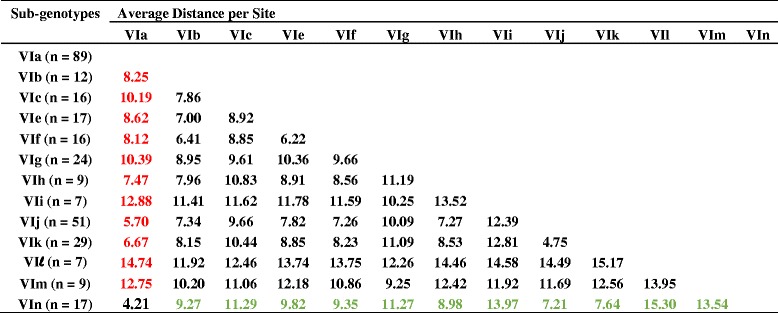
Table 2.
Estimates of evolutionary distances between genotype VI Newcastle disease virus sub-genotypes

The number of base substitutions per site from averaging over all sequence pairs between groups are shown. Analyses were conducted using the Maximum Composite Likelihood model. The rate variation among sites was modeled with a gamma distribution (shape parameter = 1). The analysis involved 307 nucleotide sequences. Codon positions included were 1st + 2nd + 3rd + Noncoding. All positions containing gaps and missing data were eliminated. Evolutionary analyses were conducted in MEGA6
